


软件

产品


import tensorflow as tffrom tensorflow.examples.tutorials.mnist import input_datatf
.compat.v1.disable_eager_execution()#载入数据集mnist=input_data.read_data_sets("MNIST_data",one_hot=True)
#每个批次大小batch_size=100#计算一共有多少个批次n_bath=mnist.train.num_examples // batch_sizeprint(n_bath)with tf
.name_scope('input'): #定义两个placeholder
x=tf.compat.v1.placeholder(tf.float32,[None,784],name='x-input') y=tf
.compat.v1.placeholder(tf.float32,[None,10],name='y-input')with tf.name_scope('layer'):
#创建一个简单的神经网络 with tf.name_scope('wights'): W=tf.Variable(tf.zeros([784,10]),name='W')
with tf.name_scope('biases'): b=tf.Variable(tf.zeros([10]),name='b')
with tf.name_scope('wx_plus_b'): wx_plus_b=tf.matmul(x,W)+b with tf.name_scope('softmax'):
prediction=tf.nn.softmax(wx_plus_b)with tf.name_scope('loss'):
#二次代价函数 loss=tf.reduce_mean(tf.square(y-prediction))with tf.name_scope('train'):
#梯度下降 train_step=tf.compat.v1.train.GradientDescentOptimizer(0.2)
.minimize(loss)#初始化变量init=tf.compat.v1.global_variables_initializer()with tf.name_scope('accuracy'):
with tf.name_scope('correct_prediction'): #结果存放在一个布尔型列表中
#返回的是一系列的True或False argmax返回一维张量中最大的值所在的位置,对比两个最大位置是否一致
correct_prediction=tf.equal(tf.argmax(y,1),tf.argmax(prediction,1)) with tf.name_scope('accuracy'):
#求准确率 #cast:将布尔类型转换为float,将True为1.0,False为0,然后求平均值
accuracy=tf.reduce_mean(tf.cast(correct_prediction,tf.float32))with tf.compat.v1.Session() as sess:
sess.run(init) writer=tf.compat.v1.summary.FileWriter('logs/',sess.graph) for epoch in range(1):
for batch in range(n_bath): #获得一批次的数据,batch_xs为图片,batch_ys为图片标签
batch_xs,batch_ys=mnist.train.next_batch(batch_size) #进行训练
sess.run(train_step,feed_dict={x:batch_xs,y:batch_ys}) #训练完一遍后,测试下准确率的变化
acc=sess.run(accuracy,feed_dict={x:mnist.test.images,y:mnist.test.labels})
print("Iter "+str(epoch)+",Testing Accuracy "+str(acc))1.2.3.4.5.6.7.8.9.10.11.12.13.14.15.16.17.18.19.
20.21.22.23.24.25.26.27.28.29.30.31.32.33.34.35.36.37.38.39.40.41.42.43.44.45.46.47.48.49.50.51.52.53.54.
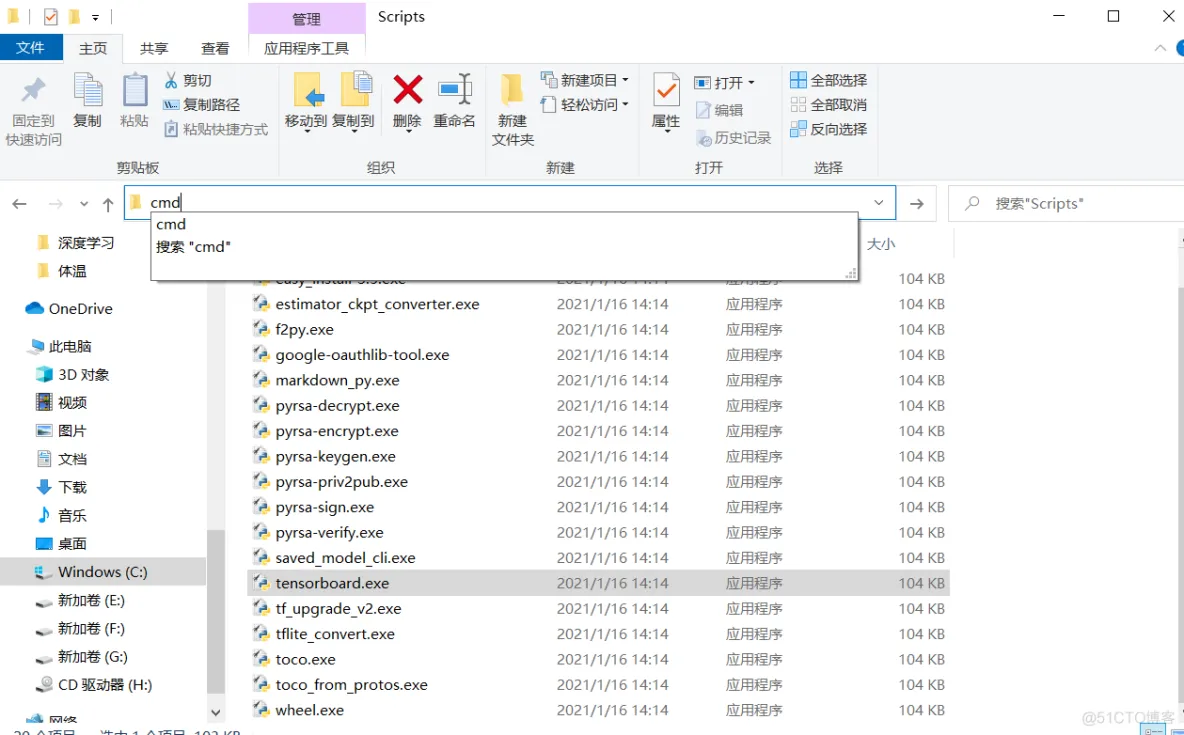
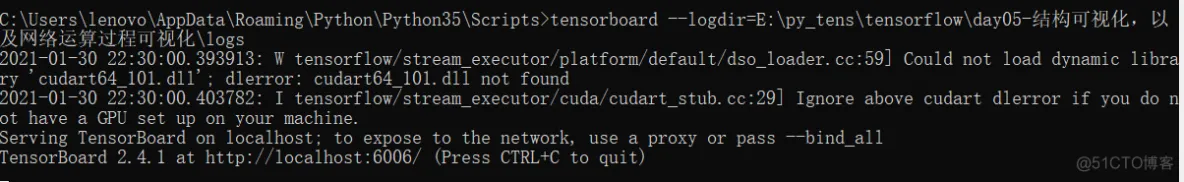
55.56.57.58.59.60.61.62.63.64.65.66.会生成logs/目录,并且目录下的文件我们需要这样子打开
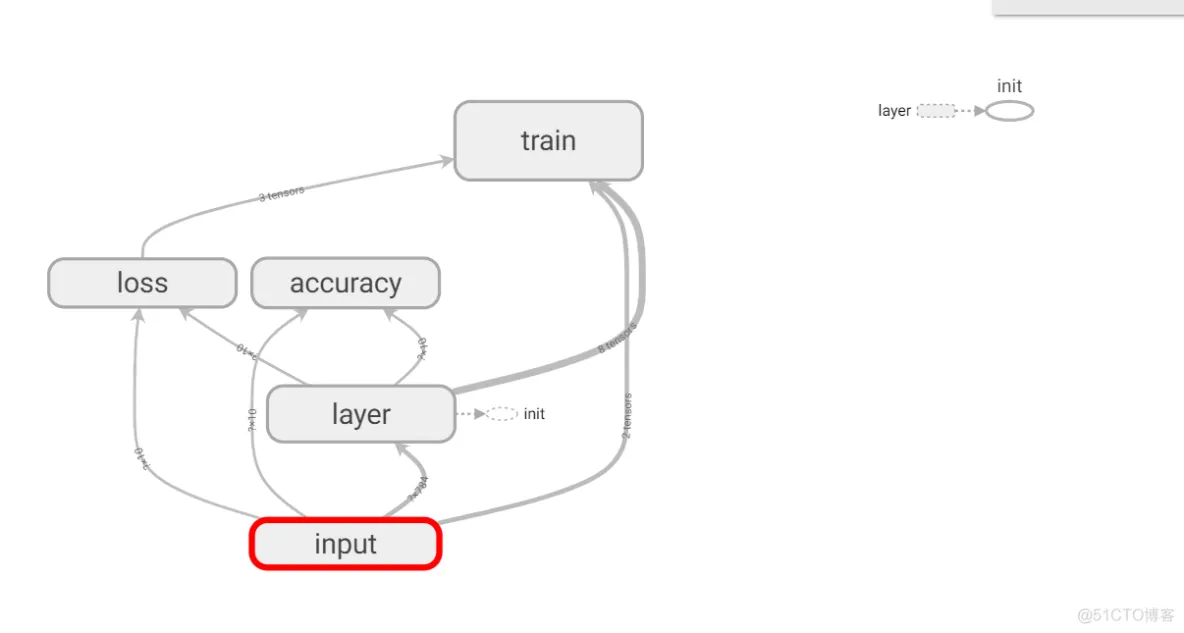
点击对应的模块,会展示详细的数据信息以及相应的结构展示
免责声明:本文系网络转载或改编,未找到原创作者,版权归原作者所有。如涉及版权,请联系删
武汉格发信息技术有限公司,格发许可优化管理系统可以帮你评估贵公司软件许可的真实需求,再低成本合规性管理软件许可,帮助贵司提高软件投资回报率,为软件采购、使用提供科学决策依据。支持的软件有: CAD,CAE,PDM,PLM,Catia,Ugnx, AutoCAD, Pro/E, Solidworks 等。
 技术文档
技术文档
 推荐好文
推荐好文


 155-2731-8020


