会把旧的图形用新的图形清除掉
>> hold on>> plot(cos(0:pi/20:2*pi));>> plot(sin(0:pi/20:2*pi));>> hold off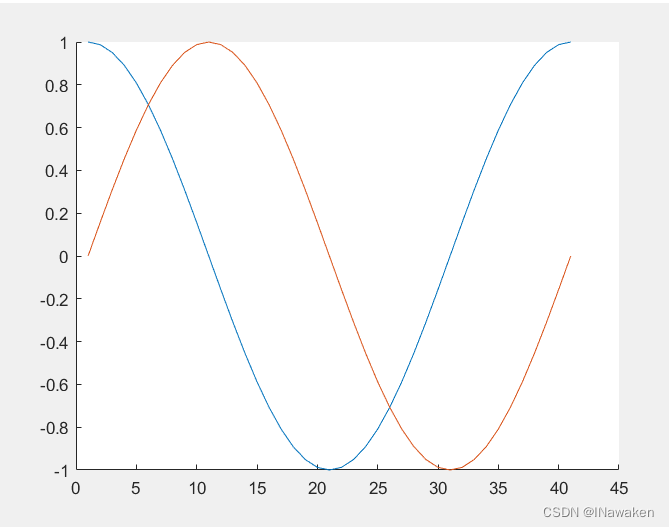
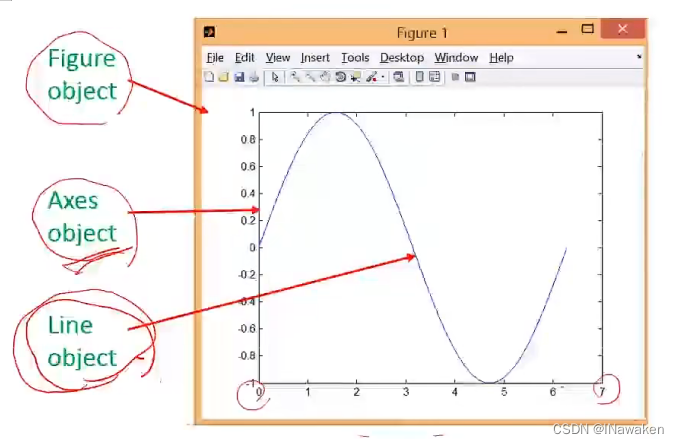
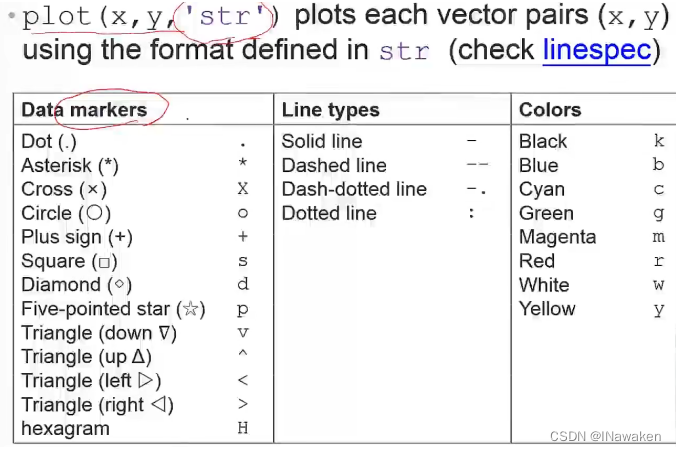
hold onplot(cos(0:pi/20:2*pi),'or--');plot(sin(0:pi/20:2*pi),'xg:');hold off

X=0:0.5:4*pi;y=sin(x);h=cos(x);w=1./(1+exp(-x));g=(1/(2*pi*2)^0.5).*exp((-1.*(x-2*pi).^2)./(2*2^2));plot(x,y,'bd-',x,h,'gp:',x,w,'ro-',x,g,'c^-');legend('sin(x)','cos(x)','Sigmoid','Gauss function');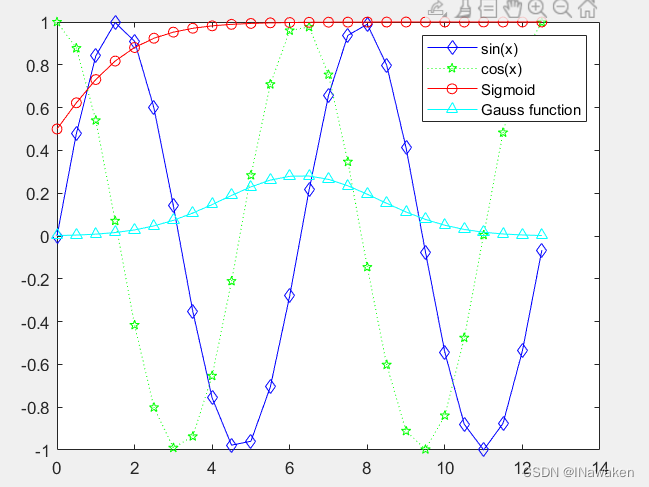
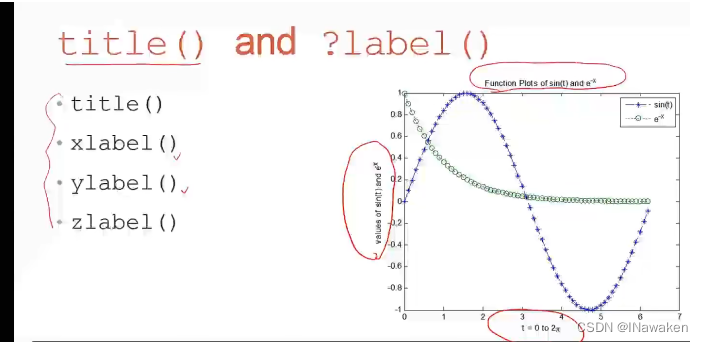
x=0:0.1:2*pi;y1=sin(x);y2=exp(-x);plot(x,y1,'--*',x,y2,':o');xlabel('t=0 to 2\pi');%\pi字源Πylabel('values of sin(t) and e^{-x}');%{-x}字源title('Function Plots of sin(t) and e^{-x}');legend('sin(t)','e^{-x}');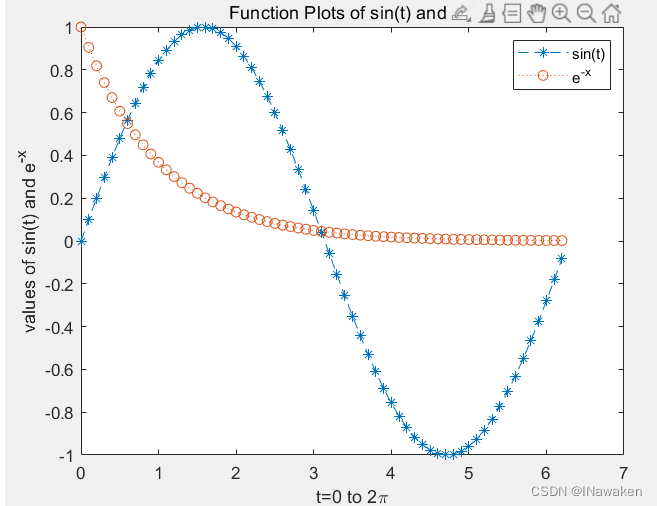
积分符号:\int
\int_{0}^{2}下标是0,上标是2
\sin宏命令,输出斜体的sin
Linspace 生成线性距离向量
y = linspace(x1,x2) 返回包含 x1 和 x2 之间的 100 个等间距点的行向量。
y = linspace(x1,x2,n) 生成 n 个点。这些点的间距为 (x2-x1)/(n-1)。
>> x = linspace(0,3);>> y=x.^2.*sin(x);>> plot(x,y);>> line([2,2],[0,2^2*sin(2)]);>> str = '$$\int_{0}^{2} x^2\sin(x) dx $$';>> text(0.25,2.5,str,'Interpreter','latex');%起点为[0.25,2.5]%使用 LaTeX 标记解释字符>> annotation('arrow','X',[0.32,0.5],'Y',[0.6,0.4]);%[0.32,0.5]:%x坐标从整个图形的32%的地方到50%的地方(从左到右)%[0.6,0.4]:y坐标从60%的地方到40%的地方(从上到下)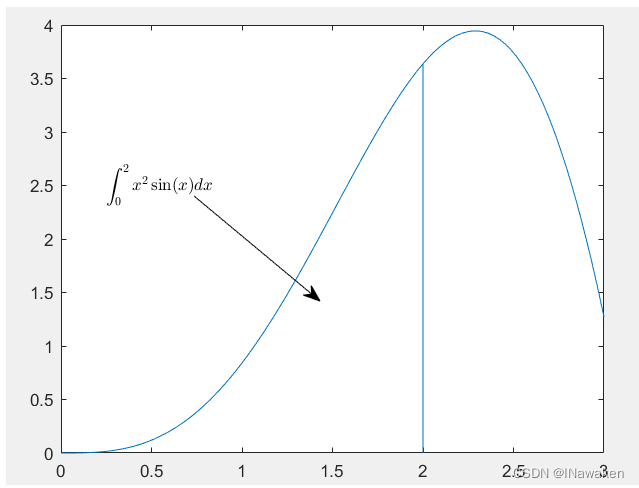
>> t=linspace(1,2);y=t.^(2);g=sin(2.*pi.*t);>> plot(y);>> plot(y,'k');>> hold on>> plot(g,'or');>> hold off>> title('Mini Assignment #1');>> xlabel('Time(ms)');>> ylabel('f(t)');>> legend('t^{2}','sin(2\pi t)');>> legend('t^{2}','sin(2\pit)');
legend('t^{2}','sin(2\pit)','Location','northwest');

x= linspace(0,2*pi,1000);>> y=sin(x);>> plot(x,y);>> h=plot(x,y);>> get(h)输出:
AlignVertexCenters: off
Annotation: [1×1 matlab.graphics.eventdata.Annotation]
BeingDeleted: off
BusyAction: 'queue'
ButtonDownFcn: ''
Children: [0×0 GraphicsPlaceholder]
Clipping: on
Color: [0 0.4470 0.7410]
ColorMode: 'auto'
ContextMenu: [0×0 GraphicsPlaceholder]
CreateFcn: ''
DataTipTemplate: [1×1 matlab.graphics.datatip.DataTipTemplate]
DeleteFcn: ''
DisplayName: ''
HandleVisibility: 'on'
HitTest: on
Interruptible: on
LineJoin: 'round'
LineStyle: '-'
LineStyleMode: 'auto'
LineWidth: 0.5000
Marker: 'none'
MarkerEdgeColor: 'auto'
MarkerFaceColor: 'none'
MarkerIndices: [1×1000 uint64]
MarkerMode: 'auto'
MarkerSize: 6
Parent: [1×1 Axes]
PickableParts: 'visible'
Selected: off
SelectionHighlight: on
SeriesIndex: 1
Tag: ''
Type: 'line'
UserData: []
Visible: on
XData: [1×1000 double]
XDataMode: 'manual'
XDataSource: ''
YData: [1×1000 double]
YDataSource: ''
ZData: [1×0 double]
ZDataSource: ''
图像:

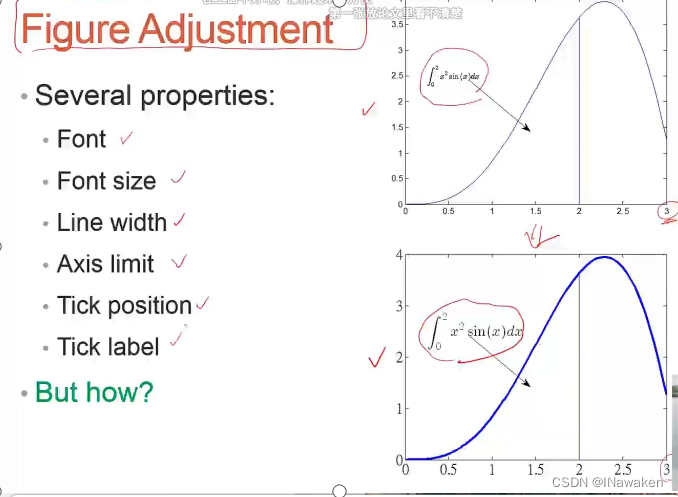
set(gca,'XLim',[0,2*pi]);%x轴的极限坐标:0-2*piset(gca,'YLim',[-1.2,1.2]);%y轴的极限坐标:-1.2-1.2%同%xlim([0,2*pi]);%ylim([-1.2,1.2]);
FontSize字体大小set(gca,'FontSize',25);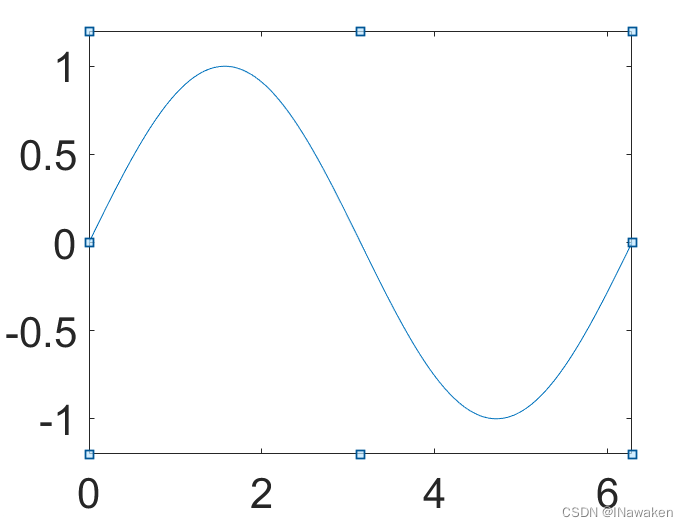
y=sin(x);plot(x,y);set(gca,'XLim',[0,2*pi]);set(gca,'YLim',[-1.2,1.2]);set(gca,'FontSize',25);set(gca,'XTick',0:pi/2:2*pi);%0-2pi间隔为pi/2,弧度制set(gca,'XTickLabel',0:90:360);%用0-360间隔为90的格式取代%set(gca,’XLim’,[0,4]);设置显示0-4的范围%set(gca,’XTick’,0:0.5:4);设置显示格式为0-4,步长为0.5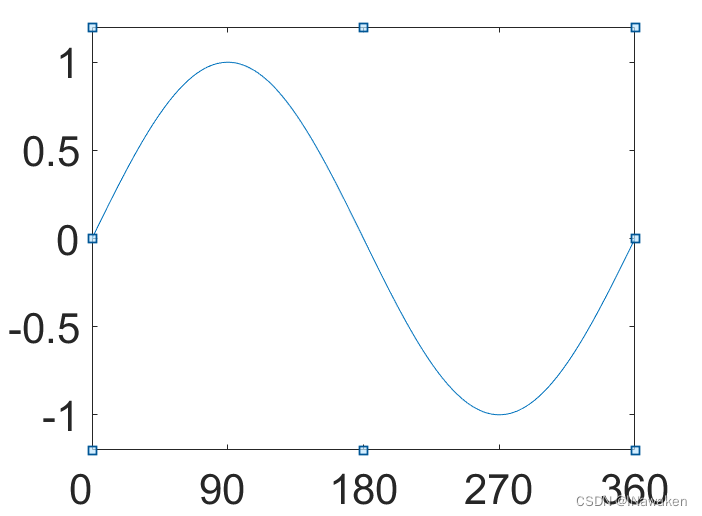
set(gca,'FontName','tex');%tex转义字符set(gca,'XTickLabel',{'0','\pi/2','\pi','3\pi/2','2\pi'});
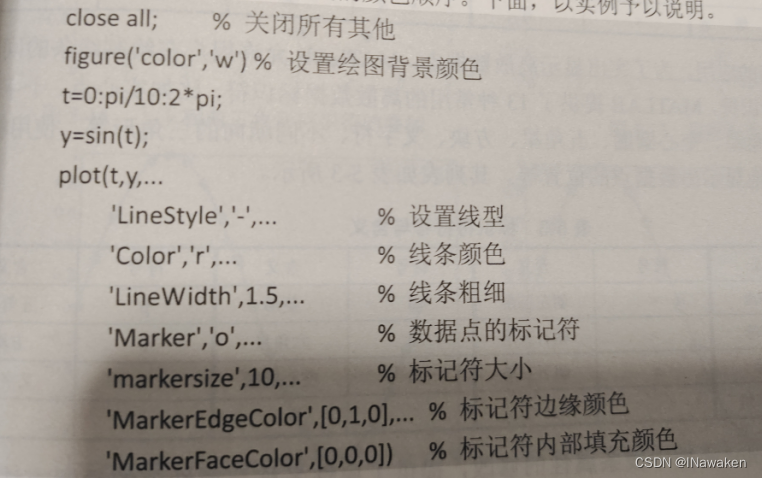
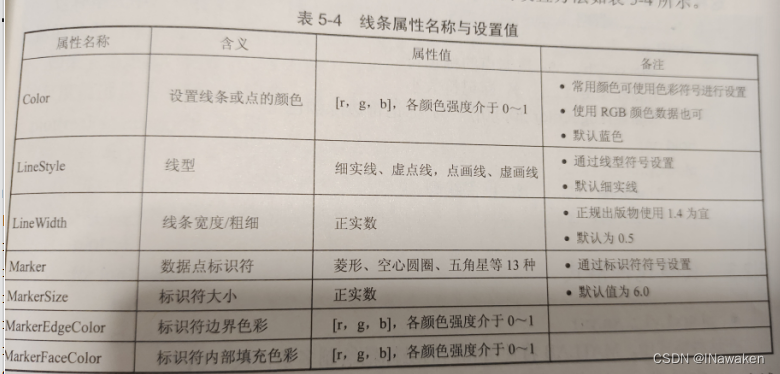
Line Specification>> x= linspace(0,2*pi,1000);>> y=sin(x);>> plot(x,y);>> h=plot(x,y);>> set(h,'LineStyle','-.','LineWidth',7.0,'Color','g');%同在绘图时直接改变:%plot(x,y,’-g’,...% ‘LineWidth’,7.0);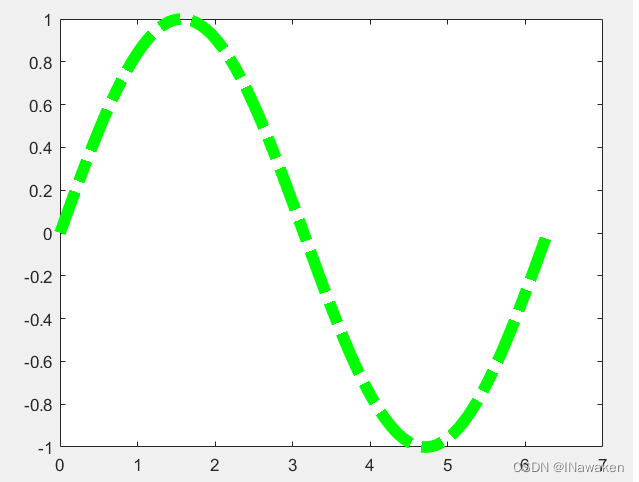
delete(h);%删除绘制的曲线h
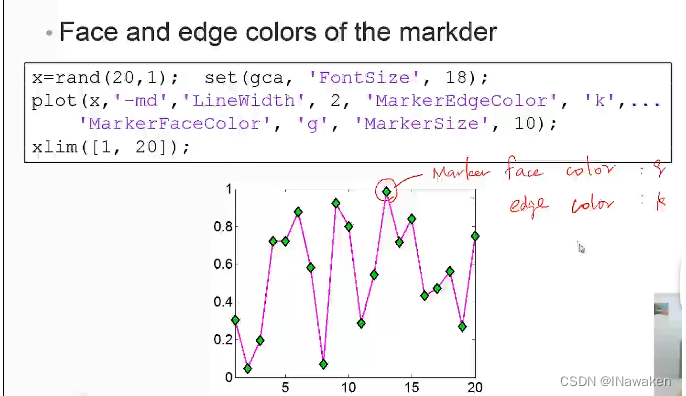
>> rand(20,1);%随机生成0-1的20*1矩阵>> set(gca,'FontSize',18);>> plot(x,'-md','LineWidth',2,'MarkerEdgeColor','k',...'MarkerFaceColor','g','MarkerSize',10);%LineWidth:线宽%MarkerEdgeColor:点的边缘颜色%MarkerFaceColor:点内部颜色%MarkerSize:点大小
hold on x=linspace(1,2); y=x.^2; z=sin(2*pi.*x);plot(x,y,'k','LineWidth',3); plot(x,z,'or','MarkerFaceColor',[0.2,0,1]);%'MarkerFaceColor',[0.2,0,1] RGB颜色set(gca,'FontSize',18); xlabel('Time(ms)'); ylabel('f(t)'); title('Mini Assignment #1');legend({'t^{2}','sin(2\pit)'},'Location','northwest'); hold off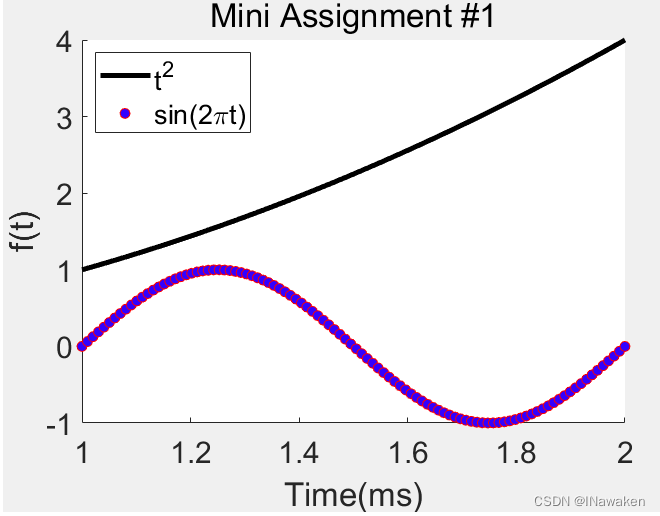
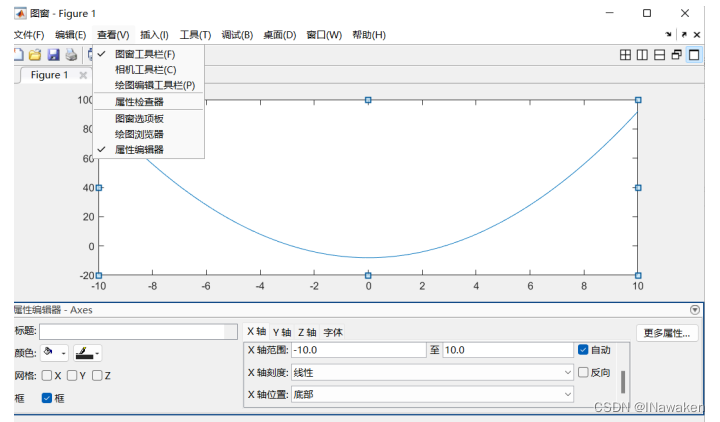
>> x=-10:0.1:10;>> y1= x.^2-8;>> y2= exp(x);>> figure,plot(x,y1);>> figure,plot(x,y2);%gca和gcf指最后绘制图像的属性 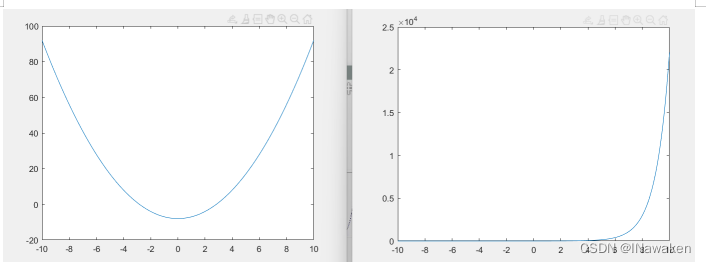

在一个figure中画很多小figure

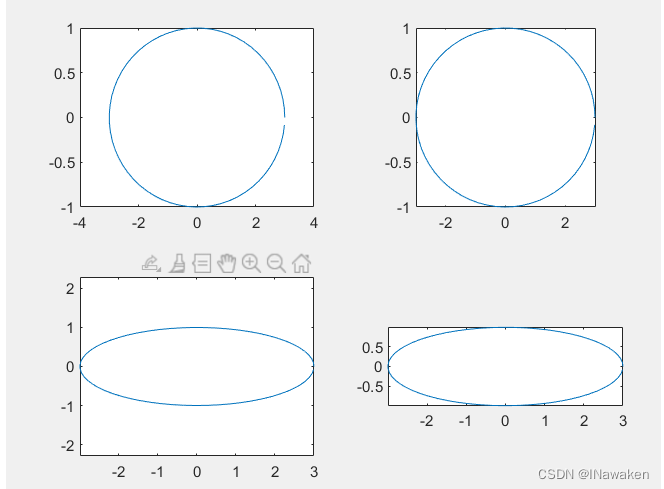
>> t=0:0.1:2*pi;>> x=3*cos(t);>> y=sin(t);>> subplot(2,2,1);>> plot(x,y);axis normal;>> subplot(2,2,2);plot(x,y);axis square;>> subplot(2,2,3);plot(x,y);axis equal;>> subplot(2,2,4);plot(x,y);axis equal tight;关于axis:
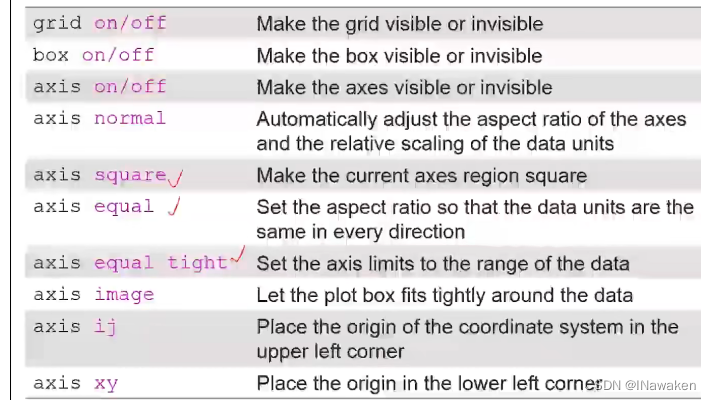
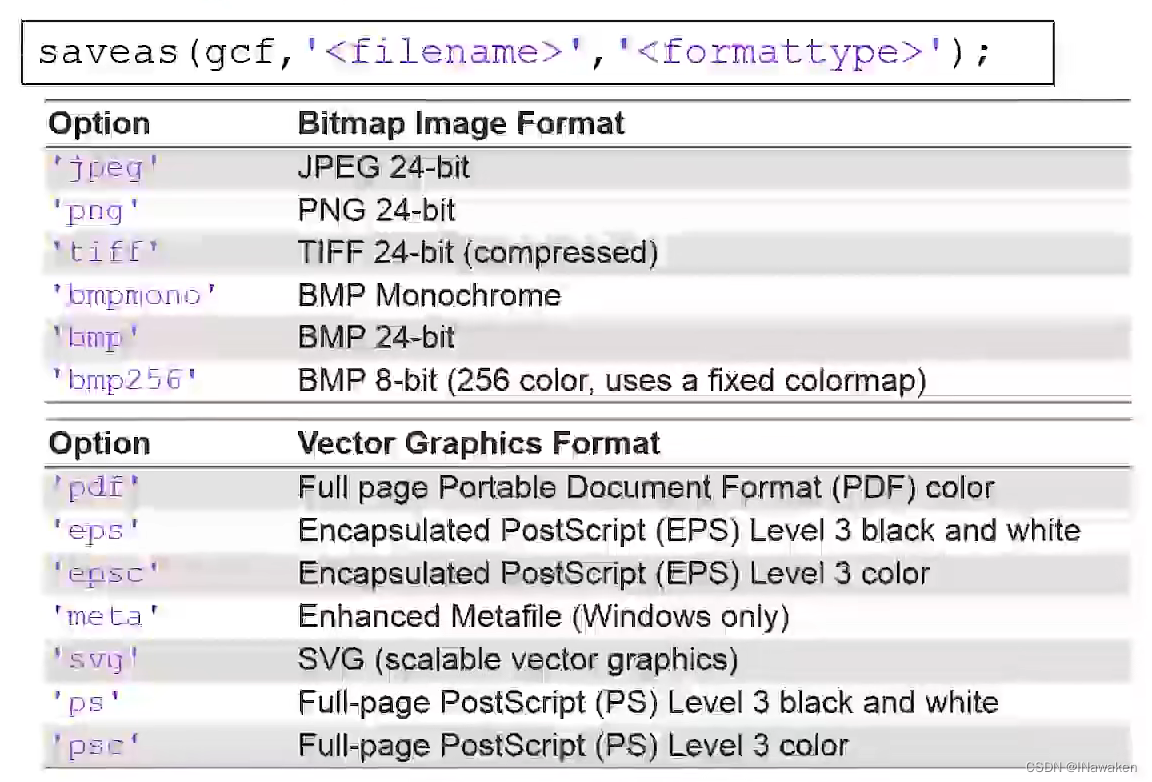
不需要代码,可直接设置
免责声明:本文系网络转载或改编,未找到原创作者,版权归原作者所有。如涉及版权,请联系删