


软件

产品


备注:代码表示形式为VBScript
clc;x = 0:0.01:1;y = (7*x)./(8-7*x)plot(x,y)xlabel('向量化百分比');ylabel('加速比');axis([0 1 0 7]);grid on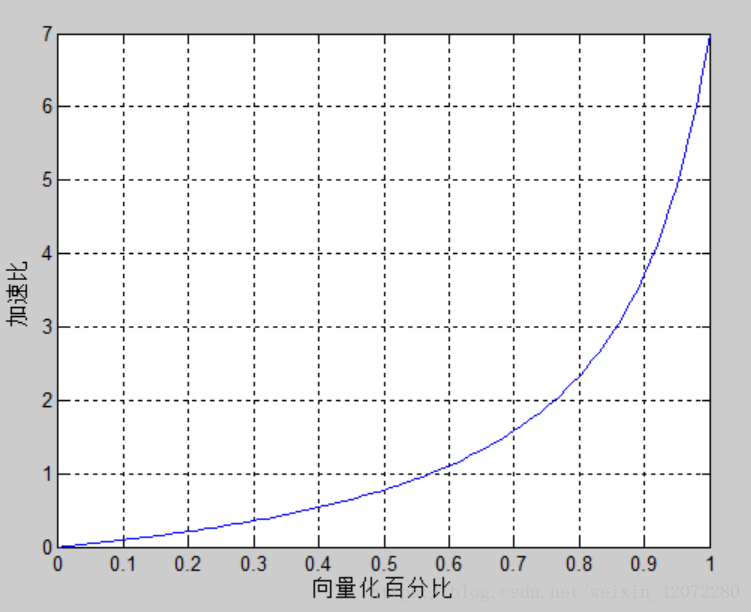
% matlab程序 clc;x = 0:1;y1 = 7*xy2 = 8-7*xy = y1 ./ y2%axis([xmin xmax ymin ymax]) %xmin是x最小,xmax是x最大,ymin,ymax类似subplot(311);plot(x,y1)subplot(312);plot(x,y2)subplot(313);plot(x,y)axis([0 1 0 7]);grid on %绘制网格线结果如下:

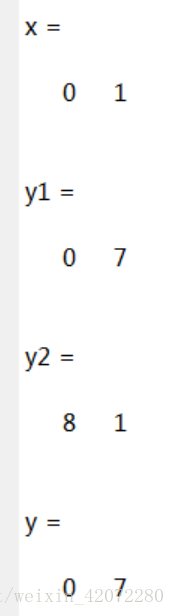
分析:这种形式下x是一个1*2矩阵,只有两个元素,分别是0和1;所以绘制出的曲线直接将x为0和1表示的点进行连接,故而是一条直线
% matlab程序 clc;x = rand(3);y1 = 7*xy2 = 8-7*xy = y1 ./ y2%axis([xmin xmax ymin ymax]) %xmin是x最小,xmax是x最大,ymin,ymax类似subplot(311);plot(x,y1)subplot(312);plot(x,y2)subplot(313);plot(x,y)axis([0 1 0 7]);grid on 
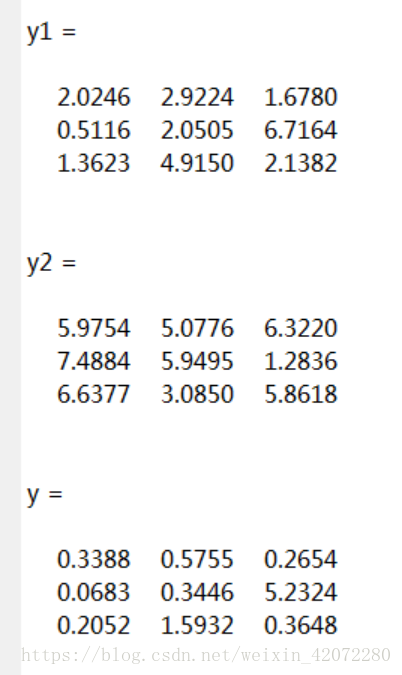
分析:rand(a,b):产生a行b列由在(0, 1)之间均匀分布的随机数组成的数组。
% matlab程序 clc;x = 0:0.01:1;y1 = 7*xy2 = 8-7*xy = y1 ./ y2%axis([xmin xmax ymin ymax]) %xmin是x最小,xmax是x最大,ymin,ymax类似subplot(311);plot(x,y1)subplot(312);plot(x,y2)subplot(313);plot(x,y)axis([0 1 0 7]);grid on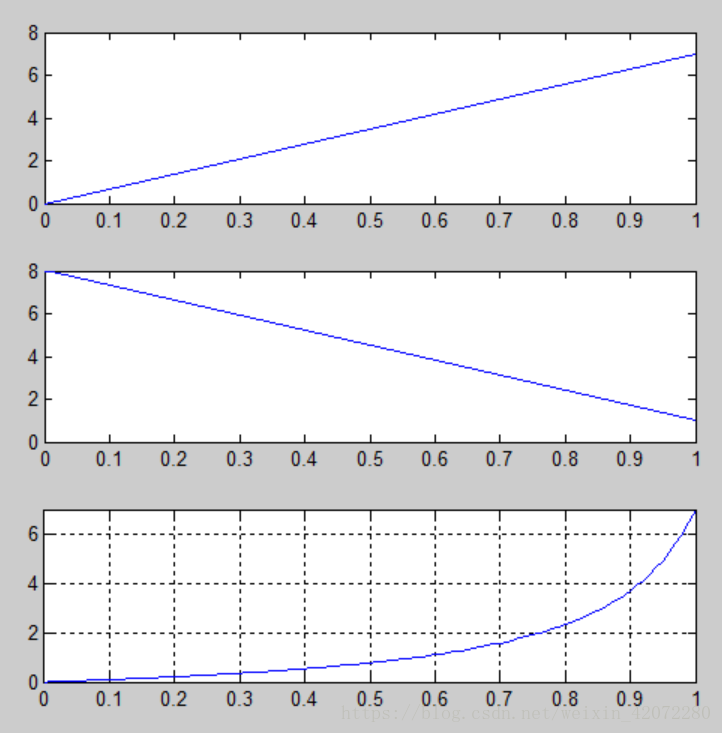
免责声明:本文系网络转载或改编,未找到原创作者,版权归原作者所有。如涉及版权,请联系删
 技术文档
技术文档
 推荐好文
推荐好文


 155-2731-8020


