


* Property xAxisData( ) As double
Returns or sets the x coordinate of the drawing view coordinate system origin. It is expressed with respect to the sheet coordinate system. This coordinate, like any length, is measured in millimeters.
Warning: This method is not available with 2D Layout for 3D Design.
Example:
This example retrieves the x coordinate of the coordinate system origin of the MyView drawing view.
X = MyView.xAxisData* Property x( ) As double
For an interactive view, get_x and put_x methods are equivalents to get_xAxisData, put_xAxisData In a generative case, get_x. put_x returns or sets the x coordinate of the projection of the 3D centre of gravity. It is expressed with respect to the sheet coordinate system. This coordinate, like any length, is measured in millimeters.
Warning: This method is not available with 2D Layout for 3D Design.
Example:
This example retrieves the x coordinate of the view relative position MyView.
X = MyView.x* Property yAxisData( ) As double
Returns or sets the y coordinate of the drawing view coordinate system origin. It is expressed with respect to the sheet coordinate system. This coordinate, like any length, is measured in millimeters.
Warning: This method is not available with 2D Layout for 3D Design.
Example:
This example sets the y coordinate of the coordinate system origin of the MyView drawing view to 5 inches. You need first to convert the 5 inches into millimeters.
NewYCoordinate = 5*25.4
MyView.yAxisData = NewYCoordinate* Property y( ) As double
For an interactive view, get_y and put_y methods are equivalents to get_yAxisData, put_yAxisData In a generative case, get_y. put_y returns or sets the y coordinate of the projection of the 3D centre of gravity. It is expressed with respect to the sheet coordinate system. This coordinate, like any length, is measured in millimeters.
Warning: This method is not available with 2D Layout for 3D Design.
Example:
This example sets the y coordinate of the view relative position MyView to 5 inches. You need first to convert the 5 inches into millimeters.
NewYCoordinate = 5*25.4
MyView.y = NewYCoordinate
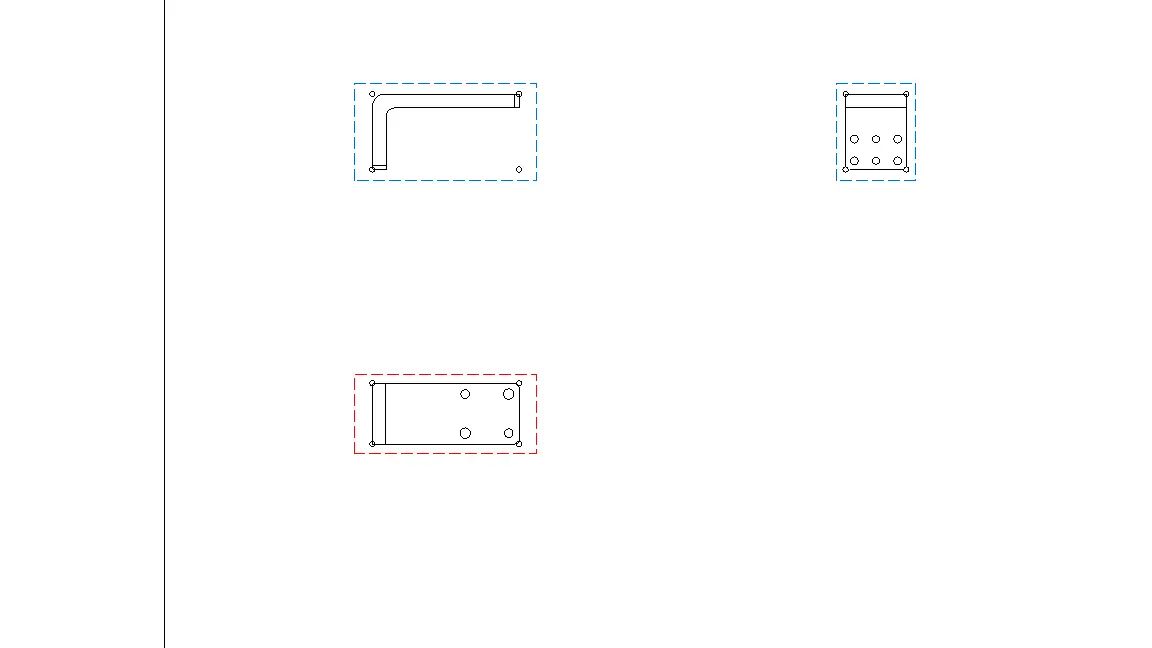
以上为官方API说明,具体对比效果如下:
-
使用.xAxisData .yAxisData
    factory.CreateCircle oXY(0) - view.xAxisData, oXY(2) - view.yAxisData, 3, 0, 2 * Dpi
    factory.CreateCircle oXY(0) - view.xAxisData, oXY(3) - view.yAxisData, 3, 0, 2 * Dpi
    factory.CreateCircle oXY(1) - view.xAxisData, oXY(2) - view.yAxisData, 3, 0, 2 * Dpi
    factory.CreateCircle oXY(1) - view.xAxisData, oXY(3) - view.yAxisData, 3, 0, 2 * Dpi
-
使用.X .Y
    factory.CreateCircle oXY(0) - view.X, oXY(2) - view.Y, 3, 0, 2 * Dpi
    factory.CreateCircle oXY(0) - view.X, oXY(3) - view.Y, 3, 0, 2 * Dpi
    factory.CreateCircle oXY(1) - view.X, oXY(2) - view.Y, 3, 0, 2 * Dpi
    factory.CreateCircle oXY(1) - view.X, oXY(3) - view.Y, 3, 0, 2 * Dpi
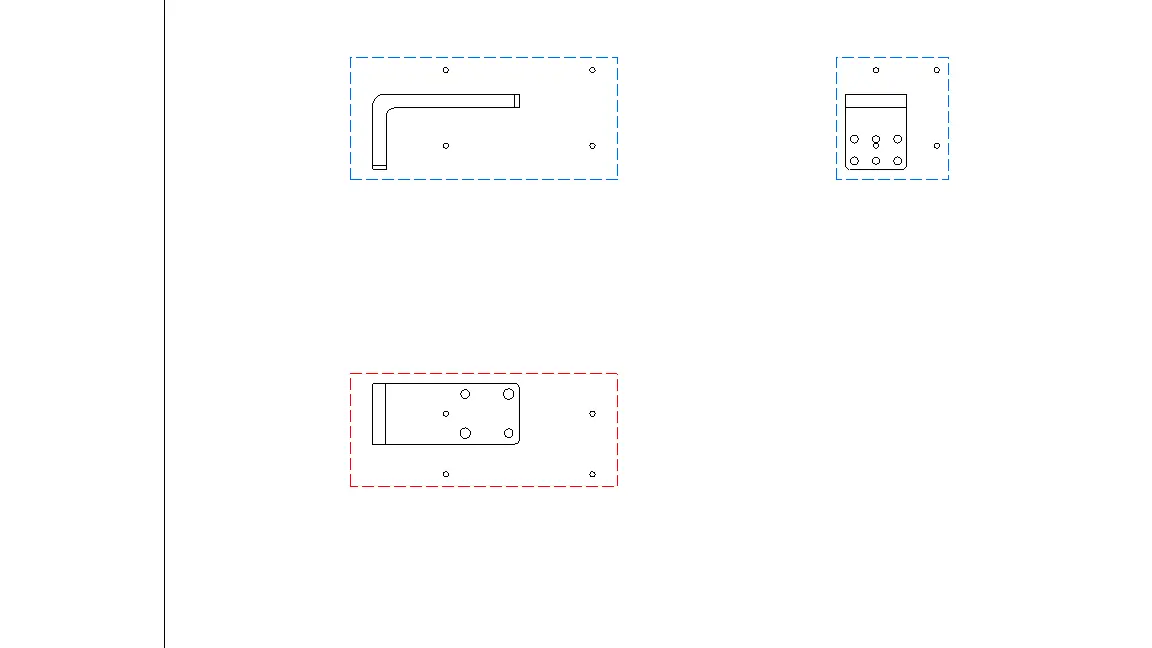
可以发现.xAxisData .yAxisData 表示的是视图中心,而.X .Y指代的是视图对应的3D图形的原点位置。
以下为完整.xAxisData .yAxisData代码参考,.X .Y可如法炮制:
Sub testCarLine()
    Dim sheet As DrawingSheet
    Set sheet = CATIA.ActiveDocument.Sheets.ActiveSheet
    Dim mainView As DrawingView
    Set mainView = sheet.Views.Item(1)
    mainView.Activate

    For i = 3 To sheet.Views.Count
        Set view = sheet.Views.Item(i)
        drawCircles view
    Next
End Sub

Sub drawCircles(view)
    Dim oXY(4)
    view.SIZE oXY()

    Dim factory As Factory2D
    Set factory = view.Factory2D

    view.Activate

    factory.CreateCircle oXY(0) - view.xAxisData, oXY(2) - view.yAxisData, 3, 0, 2 * Dpi
    factory.CreateCircle oXY(0) - view.xAxisData, oXY(3) - view.yAxisData, 3, 0, 2 * Dpi
    factory.CreateCircle oXY(1) - view.xAxisData, oXY(2) - view.yAxisData, 3, 0, 2 * Dpi
    factory.CreateCircle oXY(1) - view.xAxisData, oXY(3) - view.yAxisData, 3, 0, 2 * Dpi

End Sub
细心的朋友注意到以下代码:
For i = 3 To sheet.Views.Count
这里i从3开始,原因是一个sheet里的views.item(1)代表MainView,views.item(2)代表BackgroundView
    factory.CreateCircle oXY(0) - view.xAxisData, oXY(2) - view.yAxisData, 3, 0, 2 * Dpi
    factory.CreateCircle oXY(0) - view.xAxisData, oXY(3) - view.yAxisData, 3, 0, 2 * Dpi
    factory.CreateCircle oXY(1) - view.xAxisData, oXY(2) - view.yAxisData, 3, 0, 2 * Dpi
    factory.CreateCircle oXY(1) - view.xAxisData, oXY(3) - view.yAxisData, 3, 0, 2 * Dpi
上面的Dpi代表的是pi弧度。
DrawingView

 技术文档
技术文档
 推荐好文
推荐好文


 155-2731-8020