


软件

产品


e小白网址:www.e-xiaobai.com
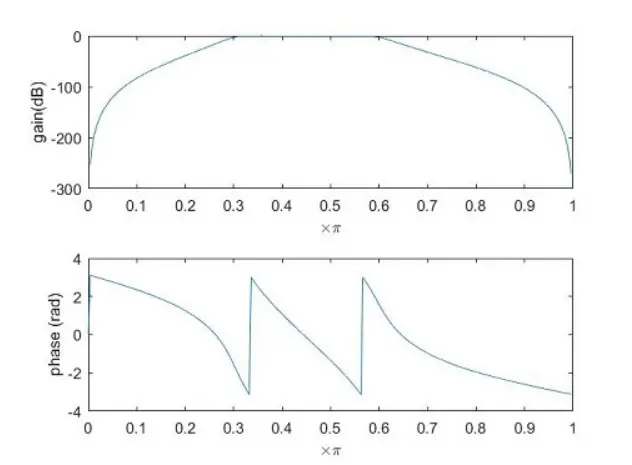
%% 设计通带为30HZ-60Hz的6阶巴特沃斯带通滤波器
% [filtered_signal,filtb,filta] = bandpass_butterworth(inputsignal,cutoff_freq,Fs,order)
% INPUTS:
% inputsignal = input time series
% cutoff_freqs = filter corner frequencies in the form [f1 f2]
% Fs = data sampling frequency
% order = order of Butterworth filter
% OUTPUTS:
% filtered_signal = the filtered time series
% filtb, filta = filter numerator and denominator (optional)
clear;clc;
t=0:0.005:5;
T=0.005;%时间间隔
Fs=1/T;%采样频率
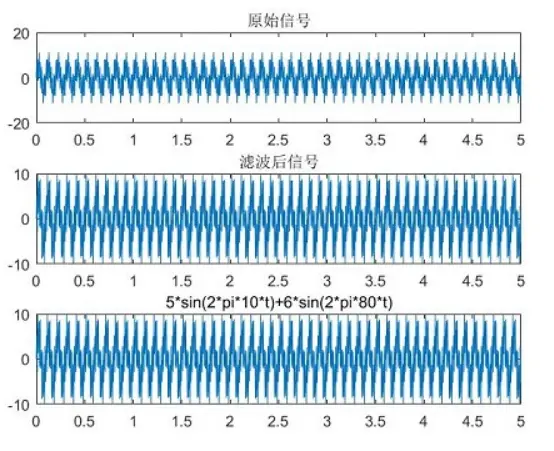
y1=5*sin(2*pi*10*t)+3*sin(2*pi*40*t)+6*sin(2*pi*80*t);
y2=3*sin(2*pi*40*t);
[filtered_signal,filtb,filta]=bandpass_butterworth(y1,[30 60],Fs,6);
figure(1)
subplot(3,1,1)
plot(t,y1)
title('原始信号')
subplot(3,1,2)
plot(t,filtered_signal)
title('滤波后信号')
subplot(3,1,3)
plot(t,y2)
title('3*sin(2*pi*40*t)')
%滤波器的幅频相频曲线
figure(2)
[h,w] = freqz(filtb,filta,256);
%[h,f] = freqz(filtb,filta,256,Fs);
subplot(2,1,1)
plot(w/pi,20*log10(abs(h)))
%plot(f,20*log10(abs(h)))
xlabel('\times\pi')
%xlabel('Hz')
ylabel('gain(dB)')
subplot(2,1,2)
plot(w/pi,angle(h))
%plot(f,angle(h))
xlabel('\times\pi')
%xlabel('Hz')
ylabel('phase (rad)')

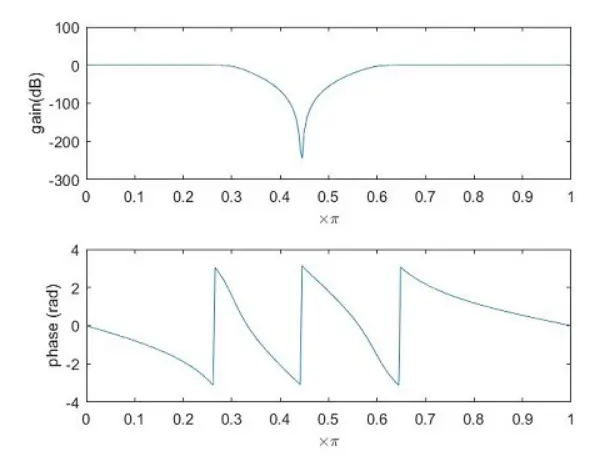
%% 设计阻带为30HZ-60Hz的6阶巴特沃斯带阻滤波器
% [filtered_signal,filtb,filta] = bandstop_butterworth(inputsignal,cutoff_freqs,Fs,order)
% INPUTS:
% inputsignal = input time series
% cutoff_freqs = filter corner frequencies in the form [f1 f2]
% Fs = data sampling frequency
% order = order of Butterworth filter
% OUTPUTS:
% filtered_signal = the filtered time series
% filtb, filta = filter numerator and denominator (optional)
clear;clc;
t=0:0.005:5;
T=0.005;%时间间隔
Fs=1/T;%采样频率
y1=5*sin(2*pi*10*t)+3*sin(2*pi*40*t)+6*sin(2*pi*80*t);
y2=5*sin(2*pi*10*t)+6*sin(2*pi*80*t);
[filtered_signal,filtb,filta]=bandstop_butterworth(y1,[30 60],Fs,6);
figure(1)
subplot(3,1,1)
plot(t,y1)
title('原始信号')
subplot(3,1,2)
plot(t,filtered_signal)
title('滤波后信号')
subplot(3,1,3)
plot(t,y2)
title('5*sin(2*pi*10*t)+6*sin(2*pi*80*t)')
%滤波器的幅频相频曲线
figure(2)
[h,w] = freqz(filtb,filta,256);
%[h,f] = freqz(filtb,filta,256,Fs);
subplot(2,1,1)
plot(w/pi,20*log10(abs(h)))
%plot(f,20*log10(abs(h)))
xlabel('\times\pi')
%xlabel('Hz')
ylabel('gain(dB)')
subplot(2,1,2)
plot(w/pi,angle(h))
%plot(f,angle(h))
xlabel('\times\pi')
%xlabel('Hz')
ylabel('phase (rad)')
注:bandpass_butterworth和bandstop_butterworth函数不为MATLAB自带函数。这两个函数可在e小白官网《MATLAB设计带通和带阻巴特沃斯滤波器》文章中下载。
武汉格发信息技术有限公司,格发许可优化管理系统可以帮你评估贵公司软件许可的真实需求,再低成本合规性管理软件许可,帮助贵司提高软件投资回报率,为软件采购、使用提供科学决策依据。支持的软件有: CAD,CAE,PDM,PLM,Catia,Ugnx, AutoCAD, Pro/E, Solidworks 等。
 技术文档
技术文档
 推荐好文
推荐好文


 155-2731-8020


