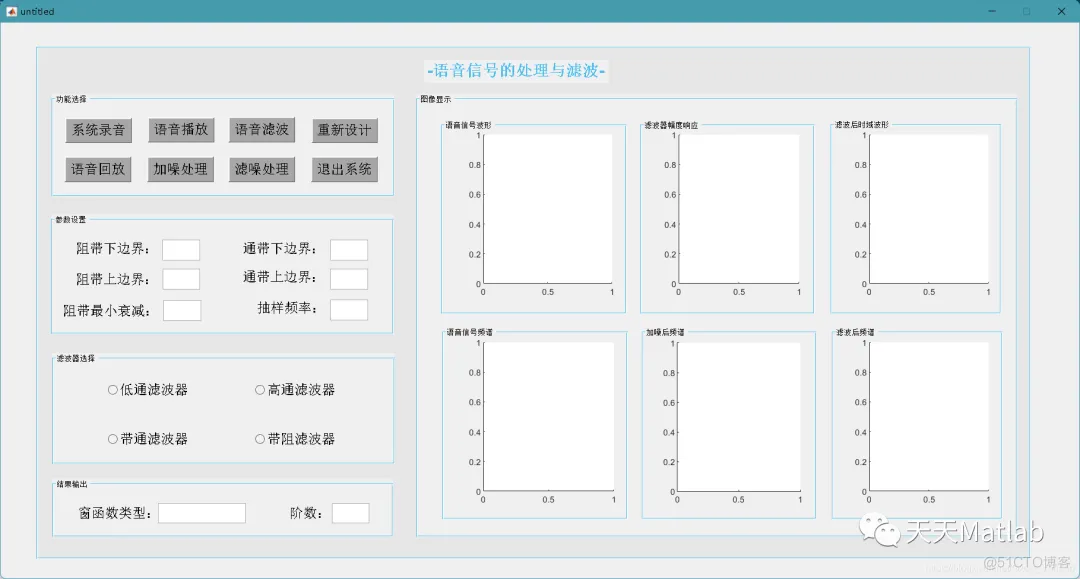
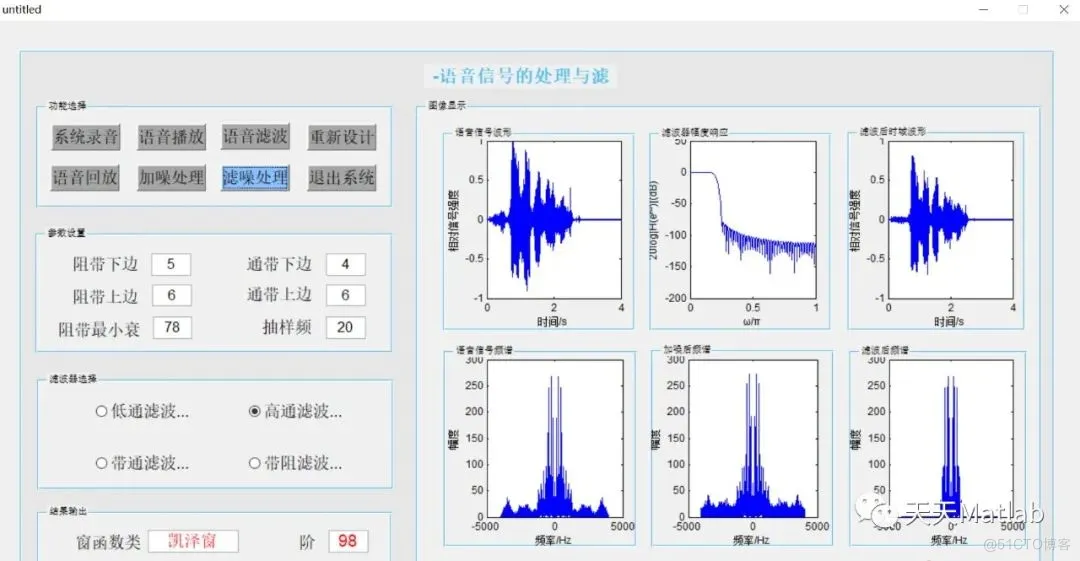
本次MATLAB设计语音信号的处理与滤波系统的GUI界面。语音信号的处理与滤波系统主要功能:录制一段自己的语音信号,并对录制的信号进行采样;画出采样后语音信号的时域波形和频谱图;给定滤波器的性能指标,采用窗函数法和双线性变换法设计滤波器,并画出滤波器的频率响应;然后用自己设计的滤波器对采集的信号进行滤波,画出滤波后信号的时域波形和频谱,并对滤波前后的信号进行对比,分析信号的变化;回放语音信号;换一个与你性别相异的人录制同样一段语音内容,分析两段内容相同的语音信号频谱之间有什么特点;再录制一段同样长时间的背景噪声叠加到你的语音信号中,分析叠加前后信号频谱的变化,设计一个合适的滤波器,能够把该噪声滤除。
GUI界面设计所用的控件主要是可编辑文本框、静态文本框、pushbutton按钮,radiobutton单选框、坐标区。
本次设计的语音信号的处理与滤波系统GUI界面如下:

1.2 系统录音
这里我写死了录音功能,点击系统录音按钮将会默认录音4秒。大家可以修改修改,增加暂停、继续等功能。
1.3 语音播放
点击语音播放按钮,将会在相应的坐标区生成相应的图像,包括原始语音信号波形图和原始语音信号频谱图,并且播放刚刚的录音文件。这里有几个点要说一下:一是我为什么不用传参来处理,因为参数是在上一次执行的函数那里生成,也就是说我执行这一步就先要执行上一步,否则系统运行就会报错,我觉得有时候这样操作有点多余,所以没有用传参处理。不过必不可少的时候还是要传参的。二是x轴标题和y轴标题问题,在有多个坐标区的时候必须要指定坐标区,否则会无法显示或者只显示到最后一个坐标区。而且xlabel函数和ylabel函数要写在plot函数下面,否则无法正常显示出x轴标题和y轴标题。
先获取输入参数,再判断要设计什么滤波器。下面代码是矩形窗设计低通滤波器的。
用audioread函数读取到路径中的音频文件,再用sound函数播放就行。
y是原声,z是加噪之后的声音,下面代码是加噪并求出加噪之后的频谱图,播放加噪后的音频。通过对比发现,信噪比snr = 10时加噪之后的频谱图效果明显,且音噪和原声也清晰。
主要用凯泽窗滤波来进行滤噪处理,这就需要传参了,把我们语音滤波那步设计的凯泽窗窗函数传下来就行,避免重新设计凯泽窗窗函数。
function varargout = untitled(varargin)
% UNTITLED MATLAB code for untitled.fig
% UNTITLED, by itself, creates a new UNTITLED or raises the existing
% singleton*.
%
% H = UNTITLED returns the handle to a new UNTITLED or the handle to
% the existing singleton*.
%
% UNTITLED('CALLBACK',hObject,eventData,handles,...) calls the local
% function named CALLBACK in UNTITLED.M with the given input arguments.
%
% UNTITLED('Property','Value',...) creates a new UNTITLED or raises the
% existing singleton*. Starting from the left, property value pairs are
% applied to the GUI before untitled_OpeningFcn gets called. An
% unrecognized property name or invalid value makes property application
% stop. All inputs are passed to untitled_OpeningFcn via varargin.
%
% *See GUI Options on GUIDE's Tools menu. Choose "GUI allows only one
% instance to run (singleton)".
%
% See also: GUIDE, GUIDATA, GUIHANDLES
% Edit the above text to modify the response to help untitled
% Last Modified by GUIDE v2.5 16-Aug-2021 15:45:41
% Begin initialization code - DO NOT EDIT
gui_Singleton = 1;
gui_State = struct('gui_Name', mfilename, ...
'gui_Singleton', gui_Singleton, ...
'gui_OpeningFcn', @untitled_OpeningFcn, ...
'gui_OutputFcn', @untitled_OutputFcn, ...
'gui_LayoutFcn', [] , ...
'gui_Callback', []);
if nargin && ischar(varargin{1})
gui_State.gui_Callback = str2func(varargin{1});
end
if nargout
[varargout{1:nargout}] = gui_mainfcn(gui_State, varargin{:});
else
gui_mainfcn(gui_State, varargin{:});
end
% End initialization code - DO NOT EDIT
% --- Executes just before untitled is made visible.
function untitled_OpeningFcn(hObject, eventdata, handles, varargin)
% This function has no output args, see OutputFcn.
% hObject handle to figure
% eventdata reserved - to be defined in a future version of MATLAB
% handles structure with handles and user data (see GUIDATA)
% varargin command line arguments to untitled (see VARARGIN)
% Choose default command line output for untitled
handles.output = hObject;
% Update handles structure
guidata(hObject, handles);
% UIWAIT makes untitled wait for user response (see UIRESUME)
% uiwait(handles.figure1);
% --- Outputs from this function are returned to the command line.
function varargout = untitled_OutputFcn(hObject, eventdata, handles)
% varargout cell array for returning output args (see VARARGOUT);
% hObject handle to figure
% eventdata reserved - to be defined in a future version of MATLAB
% handles structure with handles and user data (see GUIDATA)
% Get default command line output from handles structure
varargout{1} = handles.output;
% 系统录音
function pushbutton1_Callback(hObject, eventdata, handles)
set(handles.pushbutton1,'BackgroundColor',[0.545,0.753,0.988]);
set(handles.pushbutton2,'BackgroundColor',[0.651,0.651,0.651]);
set(handles.pushbutton3,'BackgroundColor',[0.651,0.651,0.651]);
set(handles.pushbutton4,'BackgroundColor',[0.651,0.651,0.651]);
set(handles.pushbutton5,'BackgroundColor',[0.651,0.651,0.651]);
set(handles.pushbutton6,'BackgroundColor',[0.651,0.651,0.651]);
set(handles.pushbutton7,'BackgroundColor',[0.651,0.651,0.651]);
set(handles.pushbutton8,'BackgroundColor',[0.651,0.651,0.651]);
fs = 8000; % 采样频率
duration = 4; % 时间长度(秒)
% 创建一个录音文件:fs =8000Hz, 16-bit, 单通道
voice = audiorecorder(fs, 16, 1);
recordblocking(voice, duration); % 录音2秒钟
stop(voice);
y = getaudiodata(voice);
ymax = max(abs(y)); % 归一化
y = y/ymax;
audiowrite('系统录音.wav',y,fs); % 存储录音文件
% 语音播放
function pushbutton2_Callback(hObject, eventdata, handles)
set(handles.pushbutton2,'BackgroundColor',[0.545,0.753,0.988]);
set(handles.pushbutton1,'BackgroundColor',[0.651,0.651,0.651]);
set(handles.pushbutton3,'BackgroundColor',[0.651,0.651,0.651]);
set(handles.pushbutton4,'BackgroundColor',[0.651,0.651,0.651]);
set(handles.pushbutton5,'BackgroundColor',[0.651,0.651,0.651]);
set(handles.pushbutton6,'BackgroundColor',[0.651,0.651,0.651]);
set(handles.pushbutton7,'BackgroundColor',[0.651,0.651,0.651]);
set(handles.pushbutton8,'BackgroundColor',[0.651,0.651,0.651]);
fs = 8000; % 采样频率
duration = 4; % 时间长度(秒)
n = duration*fs; % 采样点数
t = (1:n)/fs;
y = audioread('系统录音.wav'); %读取音频100到10000部分
plot(handles.axes1,t,y); % 画出声音的时域波形图
xlabel(handles.axes1,'时间/s'); % x轴标题
ylabel(handles.axes1,'相对信号强度'); % y轴标题
L = length(y);
X=fft(y,L);
A = fftshift(X);
A=abs(A);
ws = 2* pi* fs;
w1 = (-ws/2 + (0:L-1) * ws/L)/(2 * pi);
plot(handles.axes2,w1, abs(A));
xlabel(handles.axes2,'频率/Hz');
ylabel(handles.axes2,'幅度');
clear sound
sound(y);
% 语音滤波
function pushbutton3_Callback(hObject, eventdata, handles)
set(handles.pushbutton3,'BackgroundColor',[0.545,0.753,0.988]);
set(handles.pushbutton2,'BackgroundColor',[0.651,0.651,0.651]);
set(handles.pushbutton1,'BackgroundColor',[0.651,0.651,0.651]);
set(handles.pushbutton4,'BackgroundColor',[0.651,0.651,0.651]);
set(handles.pushbutton5,'BackgroundColor',[0.651,0.651,0.651]);
set(handles.pushbutton6,'BackgroundColor',[0.651,0.651,0.651]);
set(handles.pushbutton7,'BackgroundColor',[0.651,0.651,0.651]);
set(handles.pushbutton8,'BackgroundColor',[0.651,0.651,0.651]);
fs = 8000; % 采样频率
duration = 4; % 时间长度(秒)
n = duration*fs; % 采样点数
t = (1:n)/fs;
y = audioread('系统录音.wav');
L = length(y);
ws = 2* pi* fs;
w1 = (-ws/2 + (0:L-1) * ws/L)/(2 * pi);
fs1 = str2double(get(handles.edit1,'String')); %阻带下边界
fsu = str2double(get(handles.edit3,'String')); %阻带上边界
fpl = str2double(get(handles.edit2,'String')); %通带下边界
fpu = str2double(get(handles.edit4,'String')); %通带上边界
As = str2double(get(handles.edit5,'String')); %阻带最小衰减
Fs = str2double(get(handles.edit6,'String')); %抽样频率
if ( fs1 > 100 || fsu > 100 || fpl > 100 || fpu > 100 || Fs > 100 )
%msgbox('单位:kHz,请重新输入','注意');
ha=msgbox('默认单位:kHz,请重新输入 0 ~ 100','注意');
% 设置显示字体大小和粗细
hb = findobj(ha, 'Type', 'text');
set(hb, 'FontSize', 16, 'FontUnit', 'normal','FontWeight','Bold');
% 设置字体居中
th = findall(0, 'Tag','MessageBox' );
boxPosition = get(ha,'position');
textPosition = get(th, 'position');
set(th, 'position', [boxPosition(3).*1 textPosition(2) textPosition(3)]);
set(th, 'HorizontalAlignment', 'center');
set(ha,'position',[400 400 300 50]);% 使用这个语句可以修改msgbox的位置和大小
return;
end
if ( As > 80 )
%msgbox('As的范围为 0 ~ 80 ,请重新输入','注意');
ha=msgbox('As的范围为 0 ~ 80 ,请重新输入','注意');
% 设置显示字体大小和粗细
hb = findobj(ha, 'Type', 'text');
set(hb, 'FontSize', 16, 'FontUnit', 'normal','FontWeight','Bold');
% 设置字体居中
th = findall(0, 'Tag','MessageBox' );
boxPosition = get(ha,'position');
textPosition = get(th, 'position');
set(th, 'position', [boxPosition(3).*1 textPosition(2) textPosition(3)]);
set(th, 'HorizontalAlignment', 'center');
set(ha,'position',[400 400 300 50]);% 使用这个语句可以修改msgbox的位置和大小
return;
end

免责声明:本文系网络转载或改编,未找到原创作者,版权归原作者所有。如涉及版权,请联系删