产品
一.基本命令:
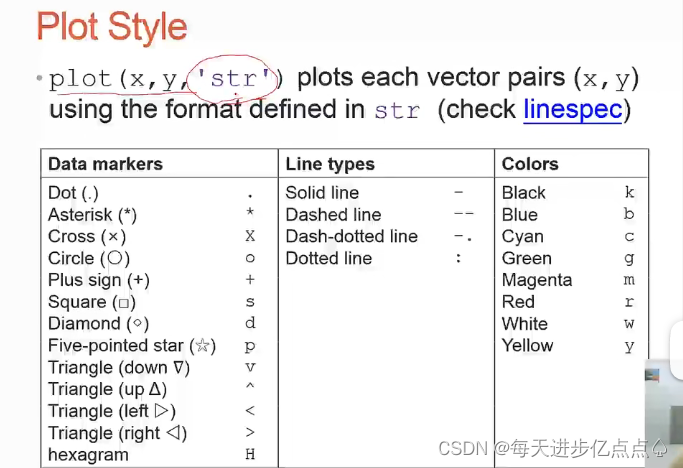
plot(); 绘图命令
hold on,hold off 清除之前的图形
legend();多图标注
xlabel();
ylabel();
zlable();
title();
text();文本
annotation();用于在图上绘制符号
关于图像字体和轴的设置命令
二.命令介绍
2.1
plot(); 绘图命令
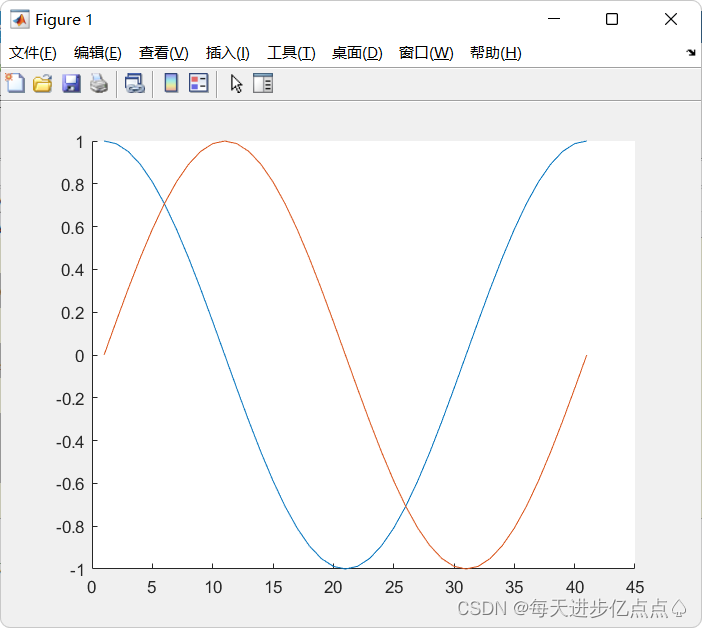
%hold on,hold off 清除之前的图形%plot(x,y)%plot(y),x=1,2,3,4...hold on plot(cos(0:pi/20:2*pi));plot(sin(0:pi/20:2*pi));hold off输出结果为
2.2 legend();多图标注
xlabel();
ylabel();
title();
%legend() 图标%xlabel%ylabel%title%zlable%hold on x=0:0.5:4*pi;y=sin(x);h=cos(x);w=1./(1+exp(-x));plot(x,y,'bd-',x,h,'gp:',x,w,'ro-');legend('sin(x)','cos(x)','sigmoid');xlabel('x');ylabel('y');title('function');%hold off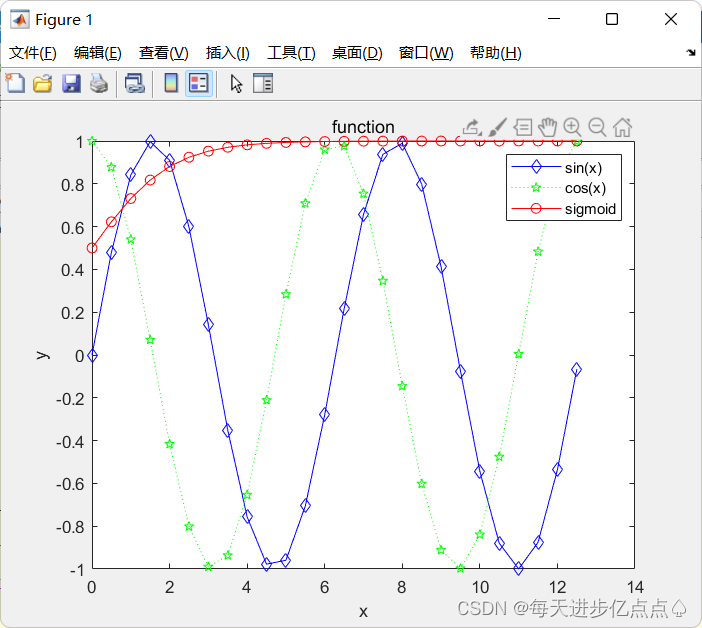
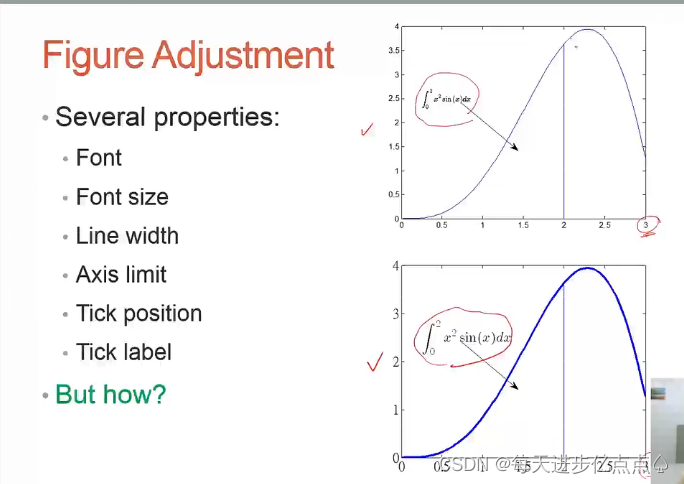
2.3text();文本
annotation();用于在图上绘制符号
%text();%annotation();x=linspace(0,3);y=x.^2.*sin(x);plot(x,y);line([2,2],[0,2^2*sin(2)]);str='$$ \int_{0}^{2} x^2\sin(x) dx $$';%'Interpreter','latex'只用latex的符号text(0.25,2.5,str,'Interpreter','latex');annotation('arrow','X',[0.32,0.5],'Y',[0.6,0.4]);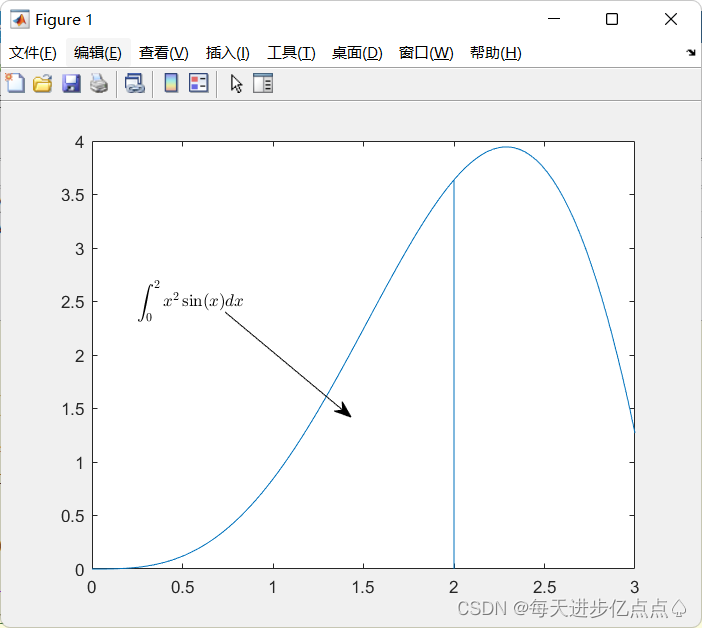
三. 图像字体和轴的设置命令
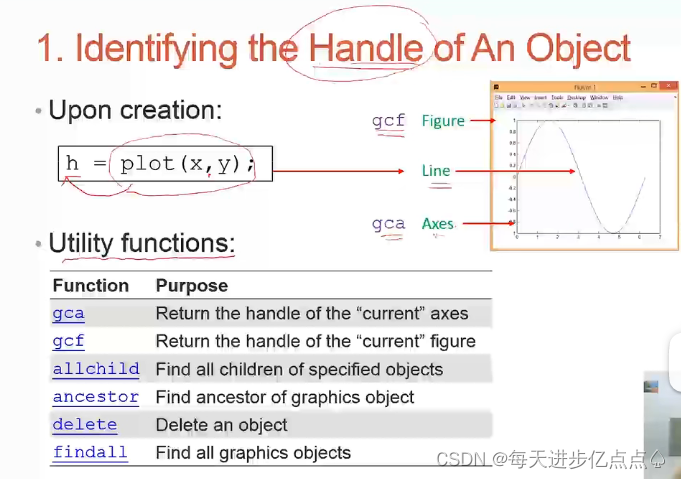
%%%gca、gcf是专门针对Figure和Axes的指令,如果针对Line,则需要定义h=plot(x,y)%get()用来获取特征;%set()用来设置特征;x=linspace(0,2*pi,1000);y=sin(x);plot(x,y);h=plot(x,y);get(h)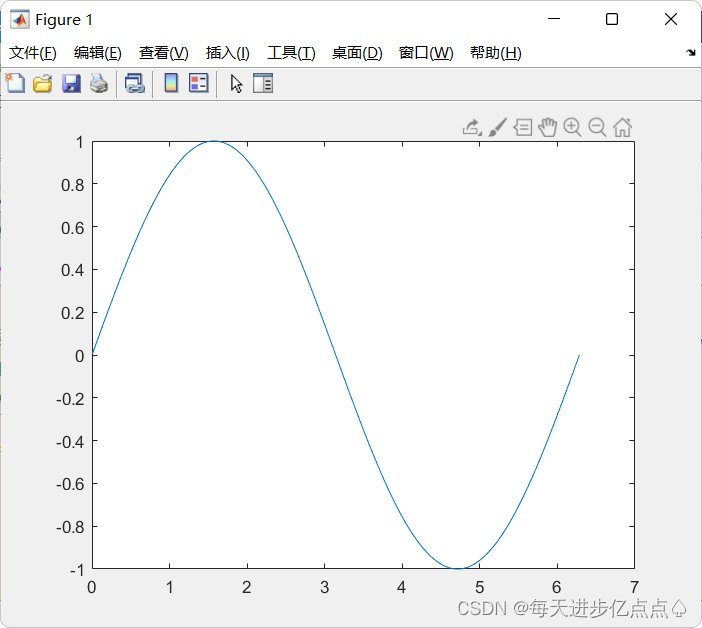
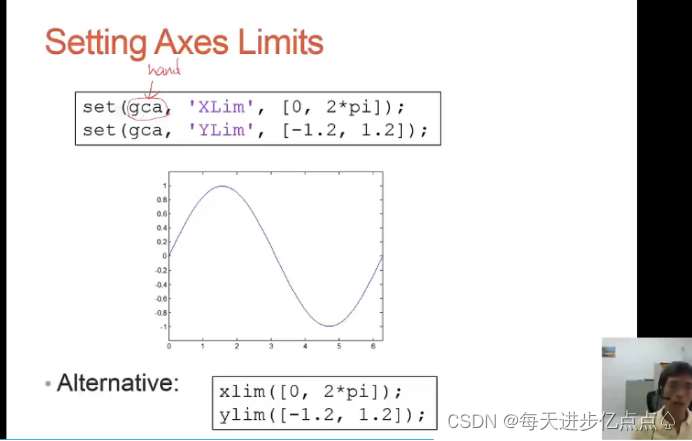
%set axes limits设置坐标的最大最小值x=linspace(0,2*pi,1000);y=sin(x);plot(x,y);set(gca,'XLim',[0,2*pi]);%xlim([0,2*pi]);set(gca,'YLim',[-1.5,1.5]);%ylim([-1.5,1.5]);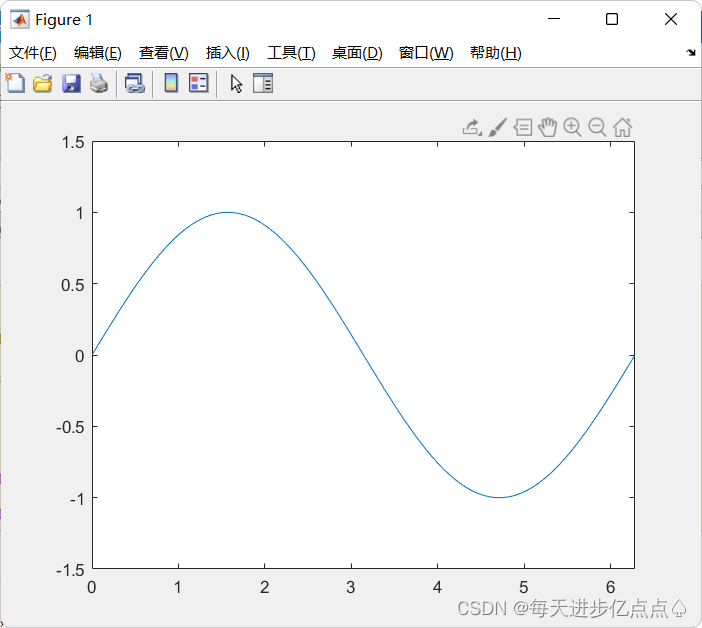
%setting font and tick of axes设置轴的字体和刻度x=linspace(0,2*pi,1000);y=sin(x);plot(x,y)set(gca,'FontSize',15);%轴的字体设置%set(gca,'XTick',0:pi/2:2*pi);%设置轴的刻度set(gca,'XTickLabel',0:90:360);%set(gca,'FontName','symbol');set(gca,'XTickLabel',{'0','\pi/2','\pi','3\pi/2','2p'});%%x=0:pi/100:2*pi;plot(x,sin(x));set(gca,'xtick',[ 0 0.5*pi pi 1.5*pi 2*pi]);xticklabels({'0','0.5\pi','\pi','1.5\pi','2\pi'})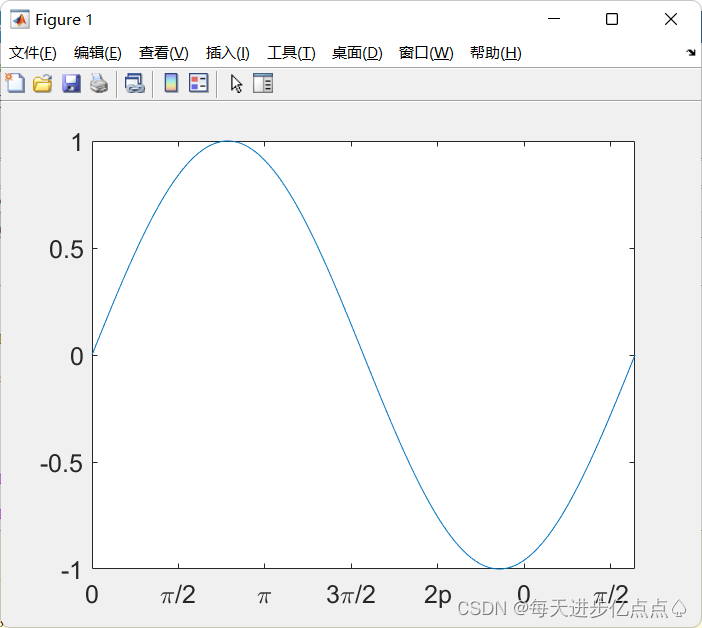
%%%Multiple Figurex=-10:0.1:10;y1=x.^2-8;y2=exp(x);figure,plot(x,y1);figure,plot(x,y2);%figure position and size%figure('Position',[left,bottom,width,height]);figure('Position',[2,2,2,2]);%%%several plots in one figure ,subplot(m.n,t)x=-10:0.1:10;y1=x.^2-8;y2=exp(x);subplot(2,1,1);plot(x,y1);subplot(2,1,2);plot(x,y2);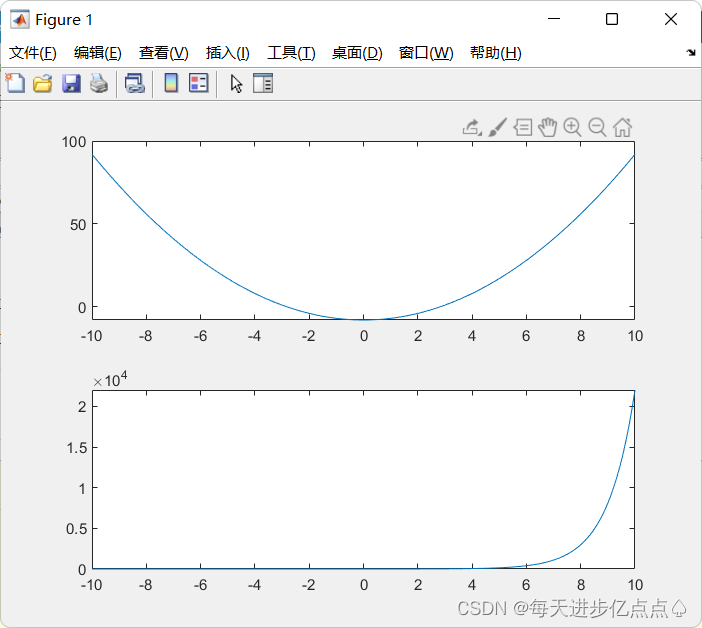
四.参考ppt
免责声明:本文系网络转载或改编,未找到原创作者,版权归原作者所有。如涉及版权,请联系删