产品
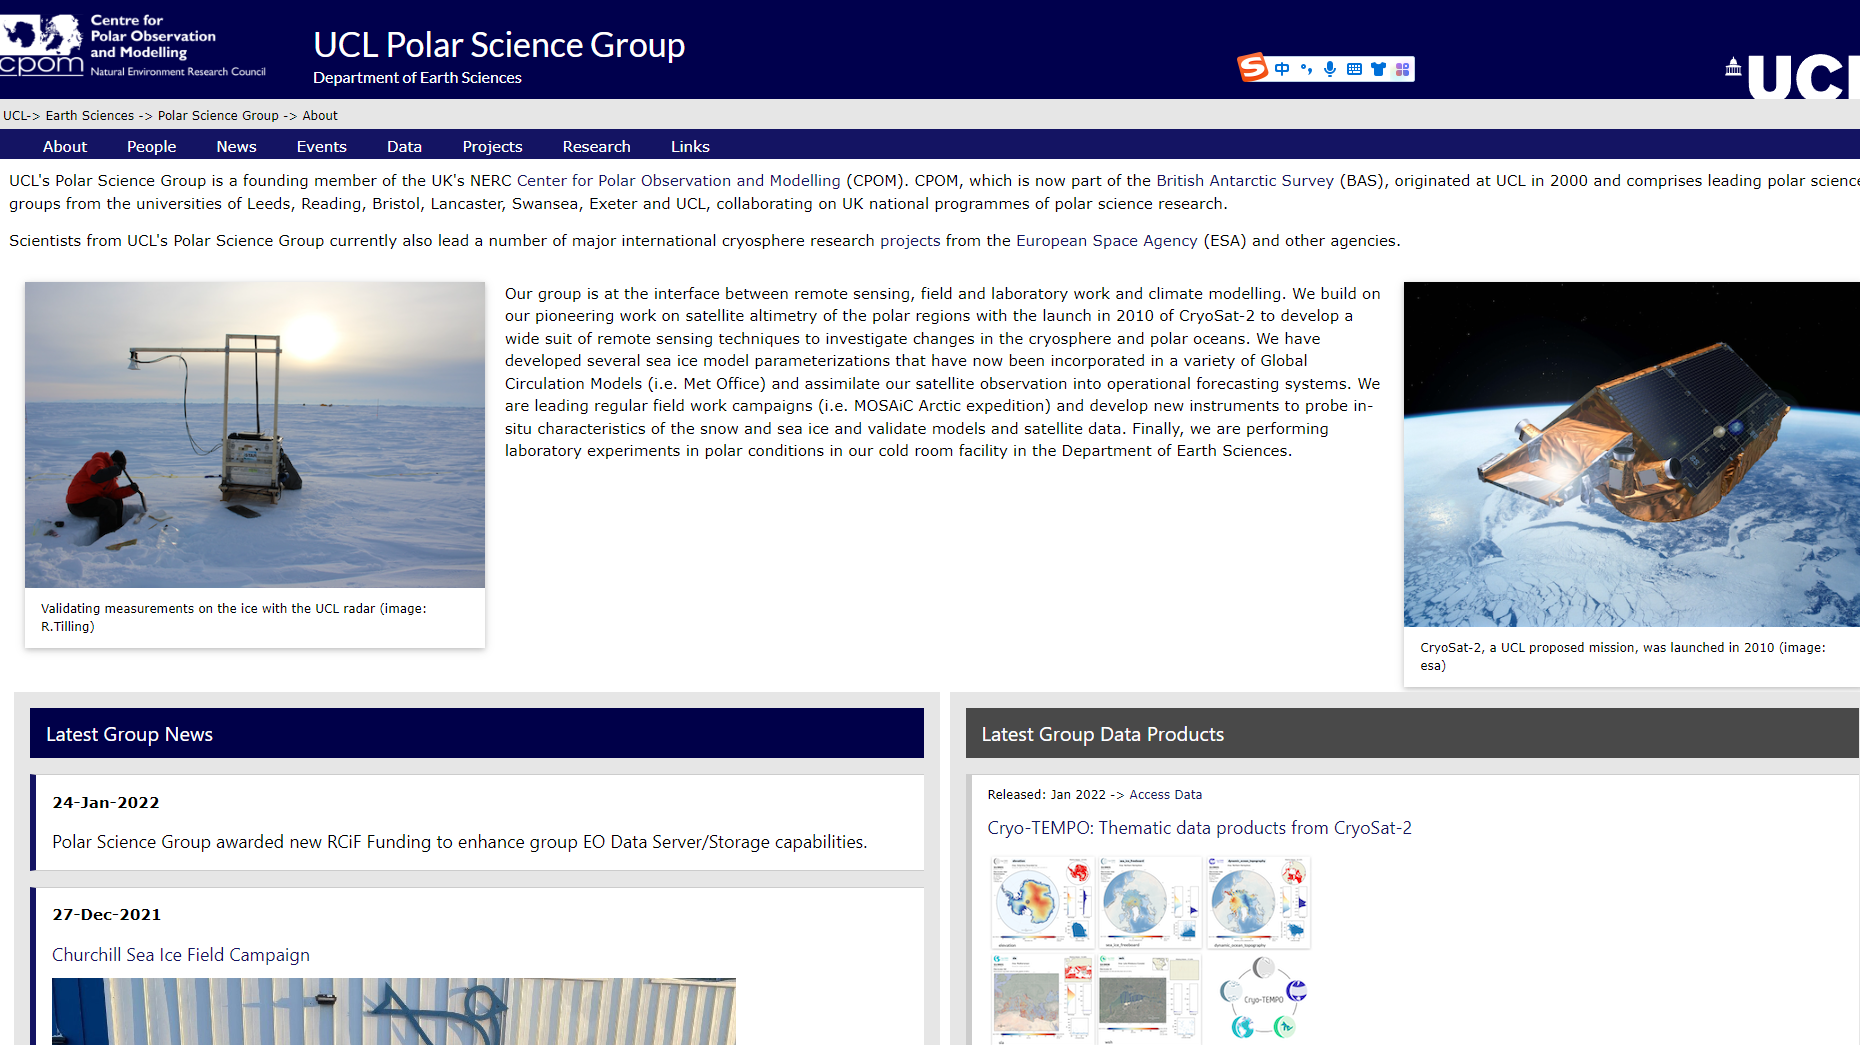
数据的官网截图

接下来我们在matlab读取和可视化地转流数据。
matlab需要提前配置好m_map地图包。使用nsdicp函数显示需要读取的nc文件内部的变量信息。读取的信息如下:
Format:
           netcdf4
Global Attributes:
           description       = 'CPOM CryoSat2 Arctic Oceanography data 2020. Written by H Heorton'
           Geoid             = UNSUPPORTED DATATYPE
           Surface_elevation = UNSUPPORTED DATATYPE
           Smoothing         = UNSUPPORTED DATATYPE
           Time_written      = UNSUPPORTED DATATYPE
           publisher_name    = UNSUPPORTED DATATYPE
           publisher_type    = UNSUPPORTED DATATYPE
           publisher_email   = UNSUPPORTED DATATYPE
           publisher_url     = UNSUPPORTED DATATYPE
           Time_dimension    = UNSUPPORTED DATATYPE
           _NCProperties     = 'version=2,netcdf=4.7.4,hdf5=1.10.5'
Dimensions:
           time = 120
           x    = 334
           y    = 334
Variables:
    Sea_level_anomaly
           Size:       334x334x120
           Dimensions: y,x,time
           Datatype:   single
           Attributes:
                       long_name = 'Sea level anomaly, elevation - CPOM2012 Mean sea surface'
                       units     = 'meters'
    time
           Size:       120x1
           Dimensions: time
           Datatype:   single
           Attributes:
                       Time_dimension = 'Days since 2000-01-01'
    DOT_smoothed
           Size:       334x334x120
           Dimensions: y,x,time
           Datatype:   single
           Attributes:
                       long_name = 'Smoothed Dynamic Ocean topography'
                       units     = 'meters'
    DOT_unsmoothed
           Size:       334x334x120
           Dimensions: y,x,time
           Datatype:   single
           Attributes:
                       long_name = 'Raw Dynamic Ocean topography, elevation - geoid height'
                       units     = 'meters'
    DOT_uncertainty_estimate
           Size:       334x334x120
           Dimensions: y,x,time
           Datatype:   single
           Attributes:
                       long_name = 'Smoothed Dynamic Ocean topography uncertainty estimate, smoothed(Smooth_DOT - Raw_DOT)'
                       units     = 'meters'
    Geo_surf_current_x
           Size:       334x334x120
           Dimensions: y,x,time
           Datatype:   single
           Attributes:
                       long_name = 'Geostrophic surface currents, curl of Smoothed DOT'
                       units     = 'meters/second'
                       component = 'x_component'
    Geo_surf_current_y
           Size:       334x334x120
           Dimensions: y,x,time
           Datatype:   single
           Attributes:
                       long_name = 'Geostrophic surface currents, curl of Smoothed DOT'
                       units     = 'meters/second'
                       component = 'y_component'
    lons
           Size:       334x334
           Dimensions: y,x
           Datatype:   single
           Attributes:
                       long_name = 'Longitude'
                       units     = 'degrees East'
    lats
           Size:       334x334
           Dimensions: y,x
           Datatype:   single
           Attributes:
                       long_name = 'Latitude'
                       units     = 'degrees North'
    xdist
           Size:       334x334
           Dimensions: y,x
           Datatype:   single
           Attributes:
                       long_name = 'grid cell spacing, x dimension'
                       units     = 'meters'
    ydist
           Size:       334x334
           Dimensions: y,x
           Datatype:   single
           Attributes:
                       long_name = 'grid cell spacing, y dimension'
                       units     = 'meters'
    ang_c
           Size:       334x334
           Dimensions: y,x
           Datatype:   single
           Attributes:
                       long_name = 'grid cell orientation, angle between y axis and north, cosine component'
                       units     = 'cos(local orientation)'
    ang_s
           Size:       334x334
           Dimensions: y,x
           Datatype:   single
           Attributes:
                       long_name = 'grid cell orientation, angle between y axis and north, sine component'
                       units     = 'sin(local orientation)'
注意:我们需要的变量类型包括:lons,lats,Geo_surf_current_x和Geo_surf_current_y.
接下来对其进行可视化,完整代码如下:
file3 = 'Full_DOT_data_Arco.nc';
ncdisp(file3)
lon = ncread(file3,'lons');
lat = ncread(file3,'lats');
xx = ncread(file3,'Geo_surf_current_x');
yy = ncread(file3,'Geo_surf_current_y');

% trend
dd = yy(:,:,12);
Oceanmask.lon = lon;
Oceanmask.lat = lat;
Oceanmask.rg  = yy(:,:,23);
% quiver (lon, lat,xx(:,:,23),yy(:,:,23),5)

figure
set(gcf,'position',[500,500,500,500])
m_proj('stereographic','lat',90,'long',0,'radius',30)
m_grid('xtick',12,'tickdir','out','ytick',3,'linest',':','xaxisloc','bottom')
hold on
m_quiver (lon, lat,xx(:,:,23),yy(:,:,23),5)
m_coast
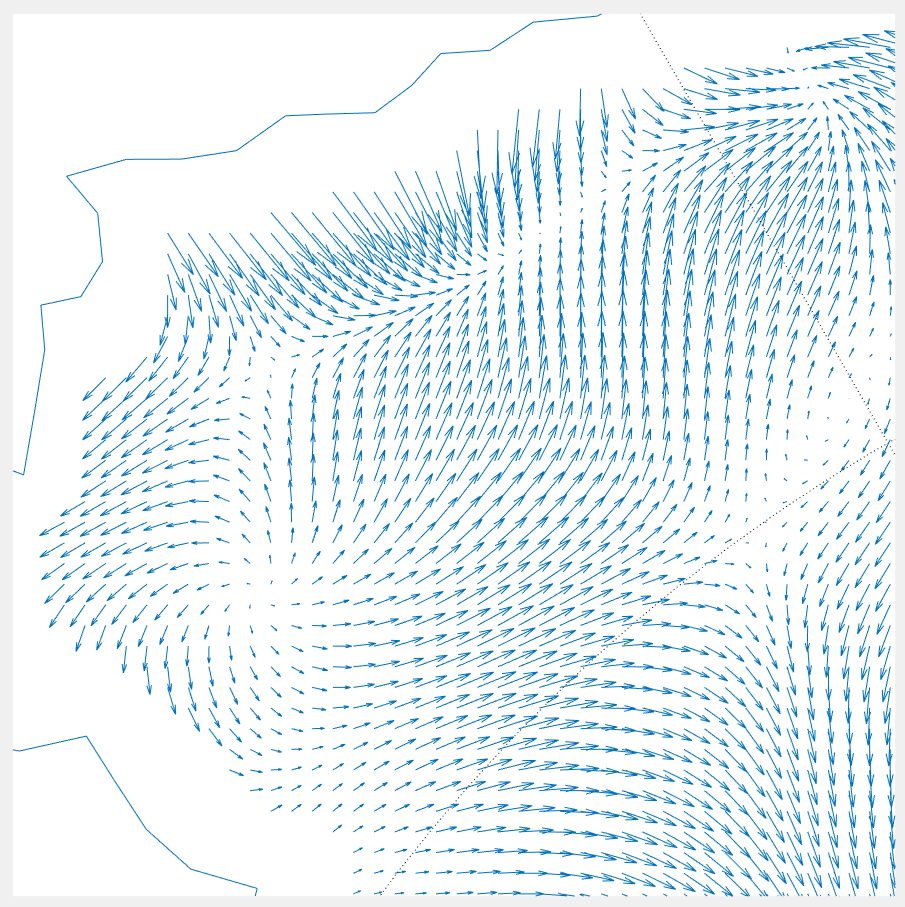
得到如下的结果:

北极地区某一个月份的地转流的空间分布
局部细节:

局部的地转流空间分布
免责声明:本文系网络转载或改编,未找到原创作者,版权归原作者所有。如涉及版权,请联系删