


软件

产品

怎么算两列数之间的 correlatoin coefficient?


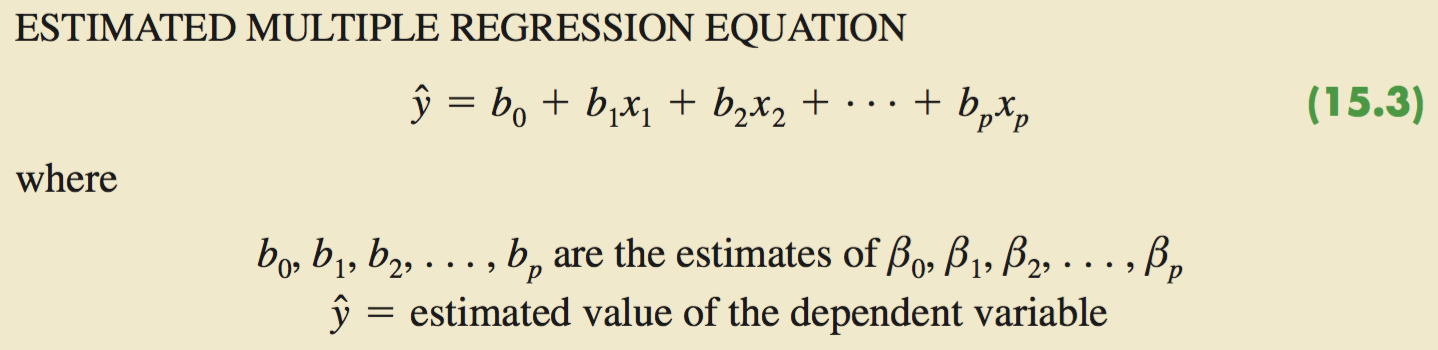


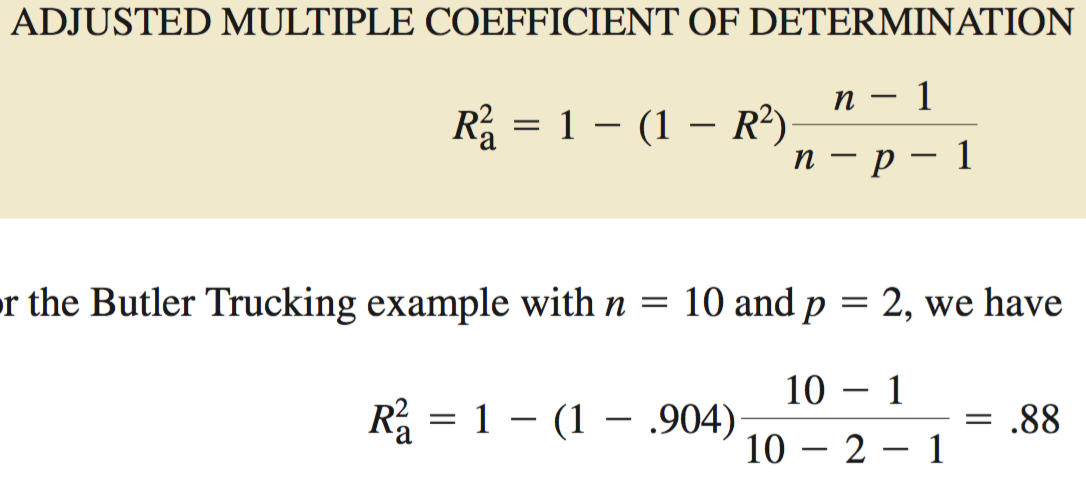
Why Adjusted?
Avoid overestimating the impact of adding an independent variable on the amount of variability explained by the estimated regression equation.
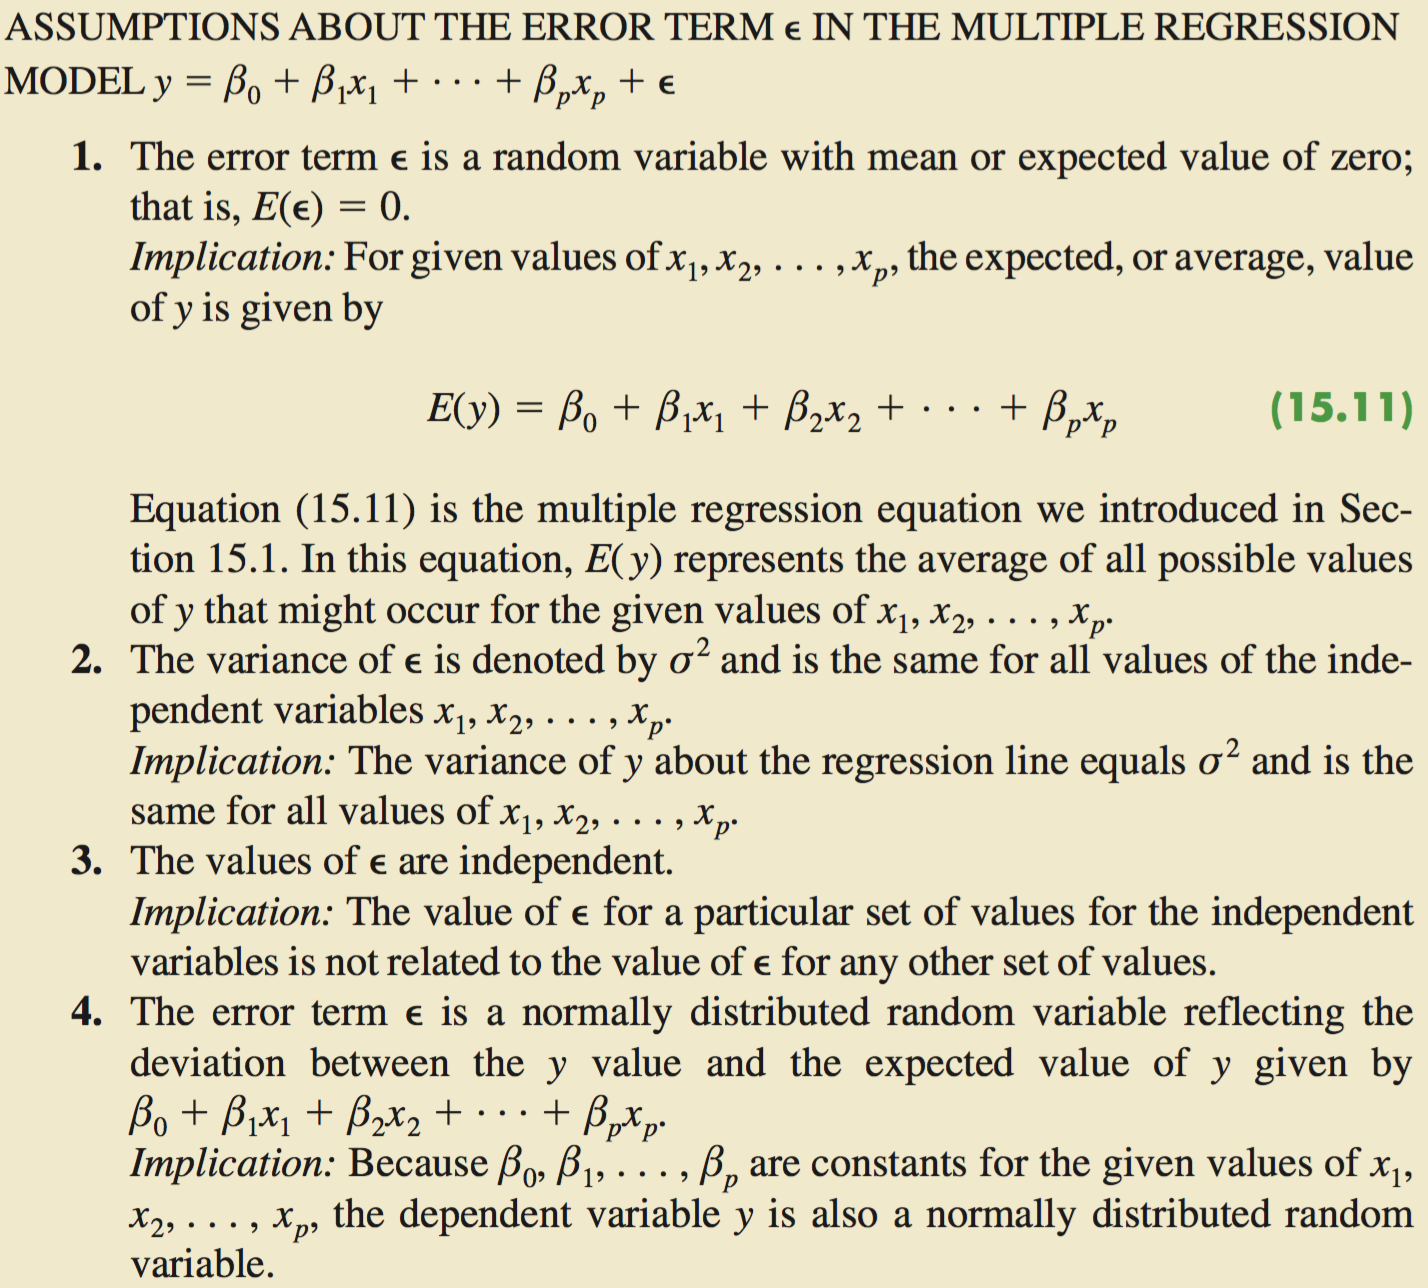
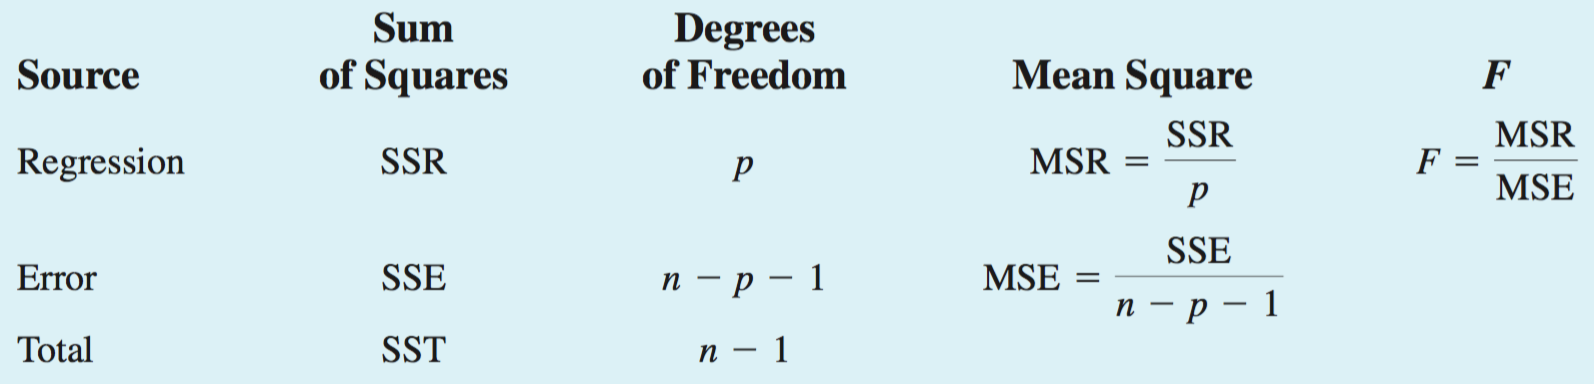
F test for overall significance; T test for individual significance
H0: β1 = β2 = … = βp = 0
Ha: One or more of the parameters is not equal to zero 
n= 观测数目
p =自变量数目
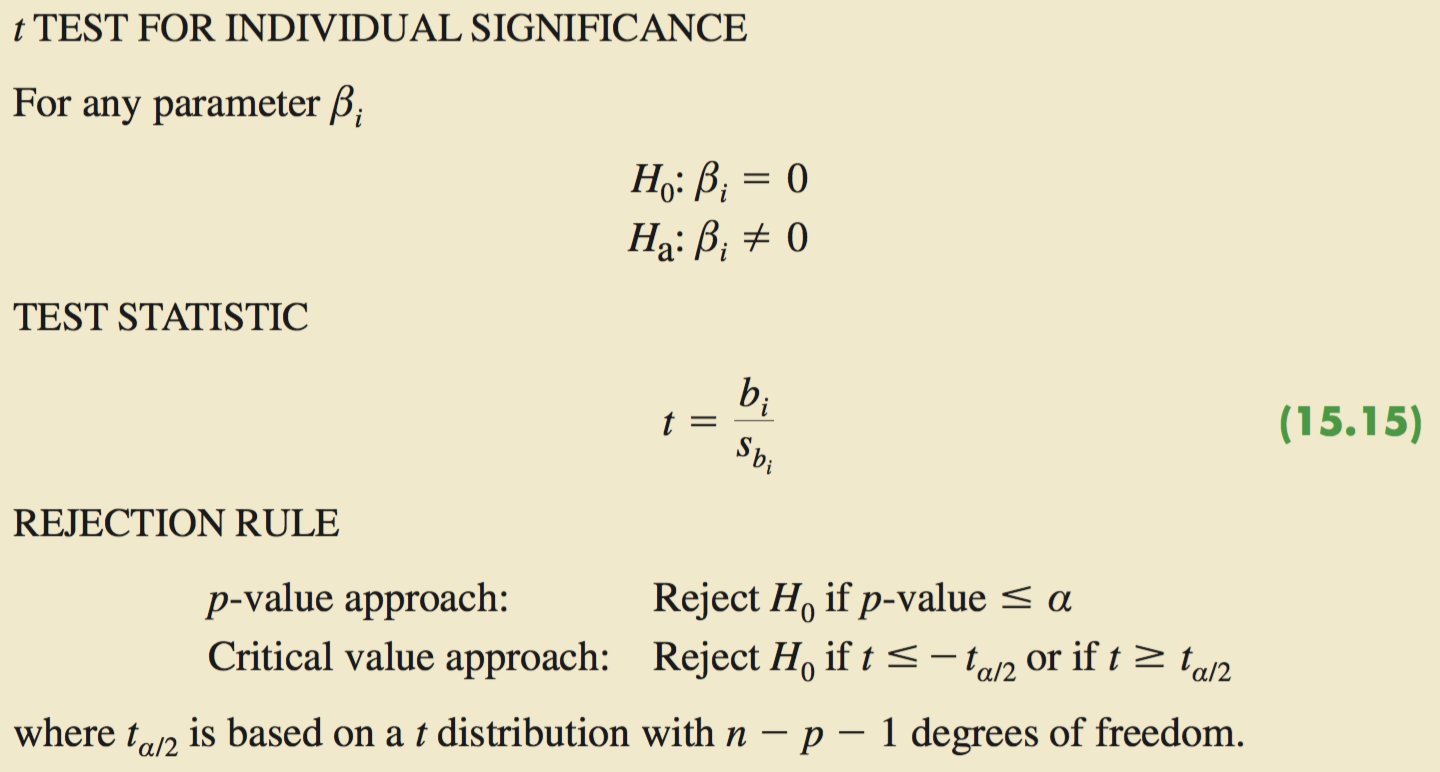
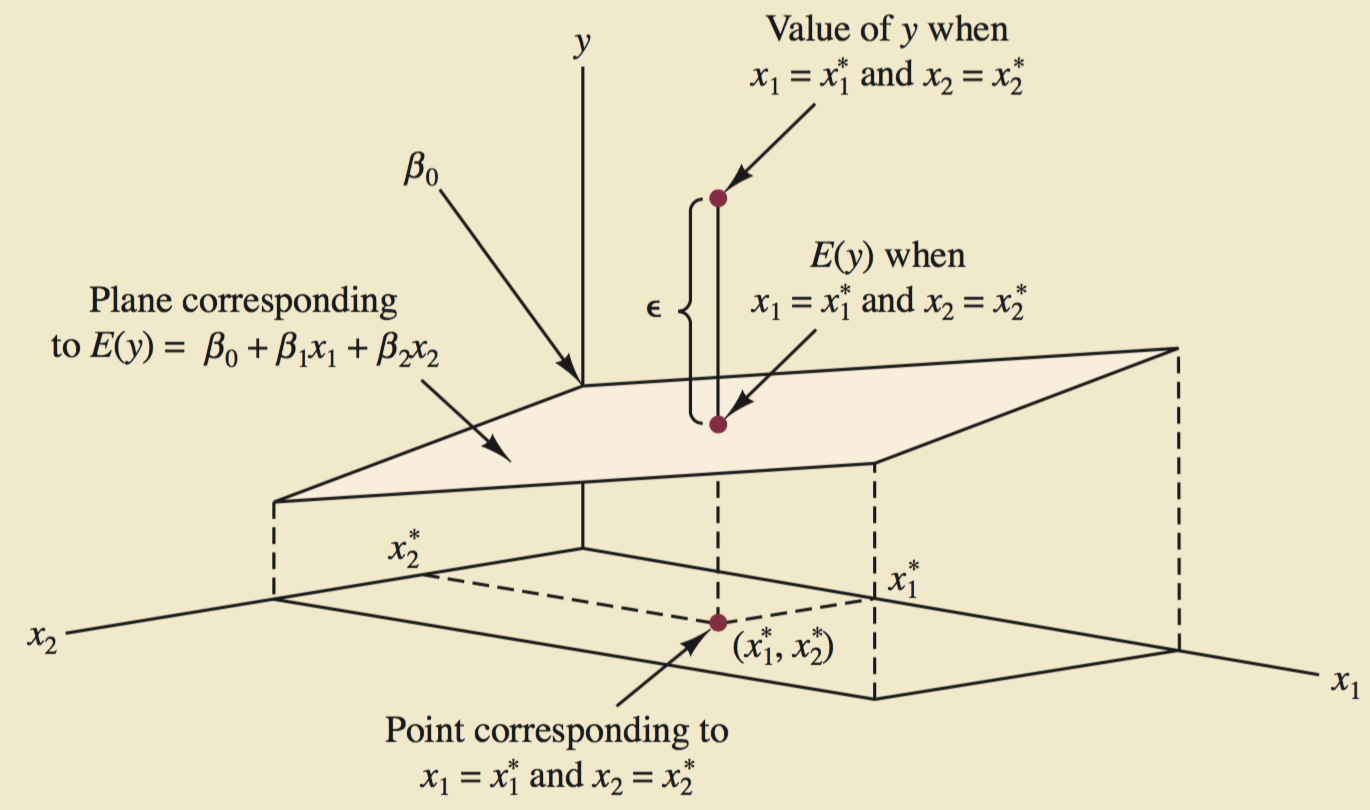
当多元回归方程总体显著性的 F 检验表明有一个显著关系时,我们可能得出单个参数没有一个是显著地不同于0的结论。只有当自变量之间的相关性非常小,才有可能回避这个问题。
F test is significant. but two t test is not significant. With x2 already in the model, x1 does not make a significant contribution to determining the value of y. 怎么发现?当两个自变量的 correlation coefficient >0.7
如果 qualitative variables 是两个的话,那么可以变成 0 1
The important point to remember is that when a qualitative variable has k levels, k-1 dummy variables are required in the multiple regression analysis.
Minitab classifies an observation as an outlier if the value of its standardized residual is less than -2 or greater than +2.
Minitab computes the leverage values and uses the rule of thumb hi > 3( p + 1)/n to identify influential observations.
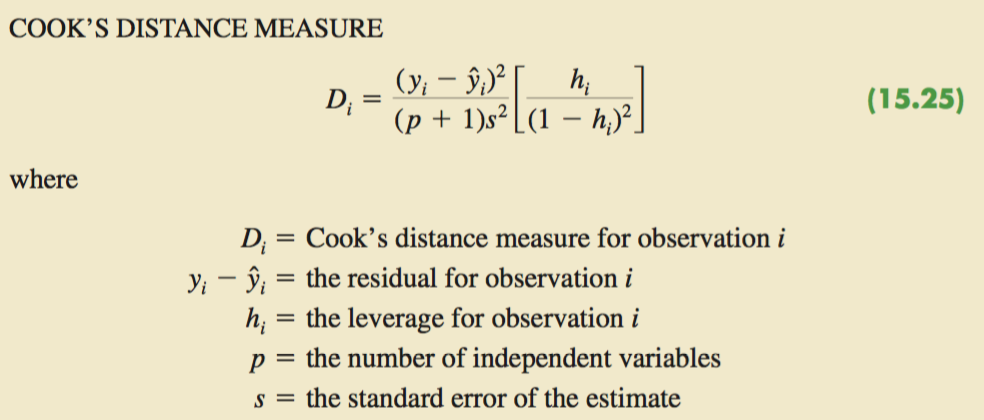
如果 Di >1,那么表明第 i 次观测值是一个有影响力的观测值,并对这个观测值做进一步的考察。


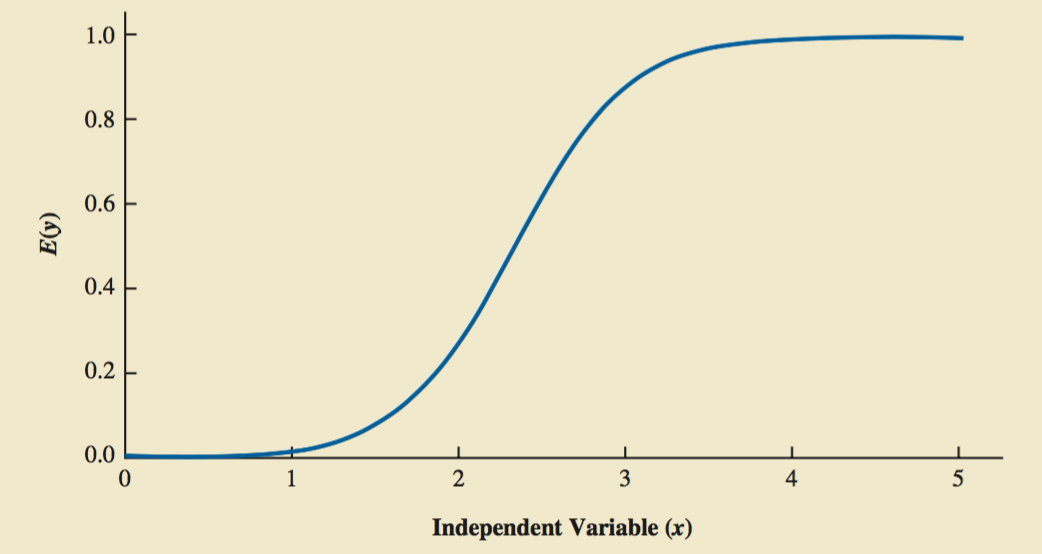
The Probability of y=1 given x1,x2,…,xp
H0: β1 = β2 = 0
Ha: One or both of the parameters is not equal to zero
G follows a chi-square distribution with degrees of freedom equal to the number of independent variables in the model
如果是一个个的 Variable,就用 z test
问题是:发 coupon,想预测一下哪些消费者在收到 coupon 会用?
通过 logistics regression,得到下面的这张表: 
结果:
Customers who have a Simmons credit card: Send the catalog to every customer who spent 2000 or more last year
Customers who do not have a Simmons credit card: Send the catalog to every customer who spent 6000 or more last year
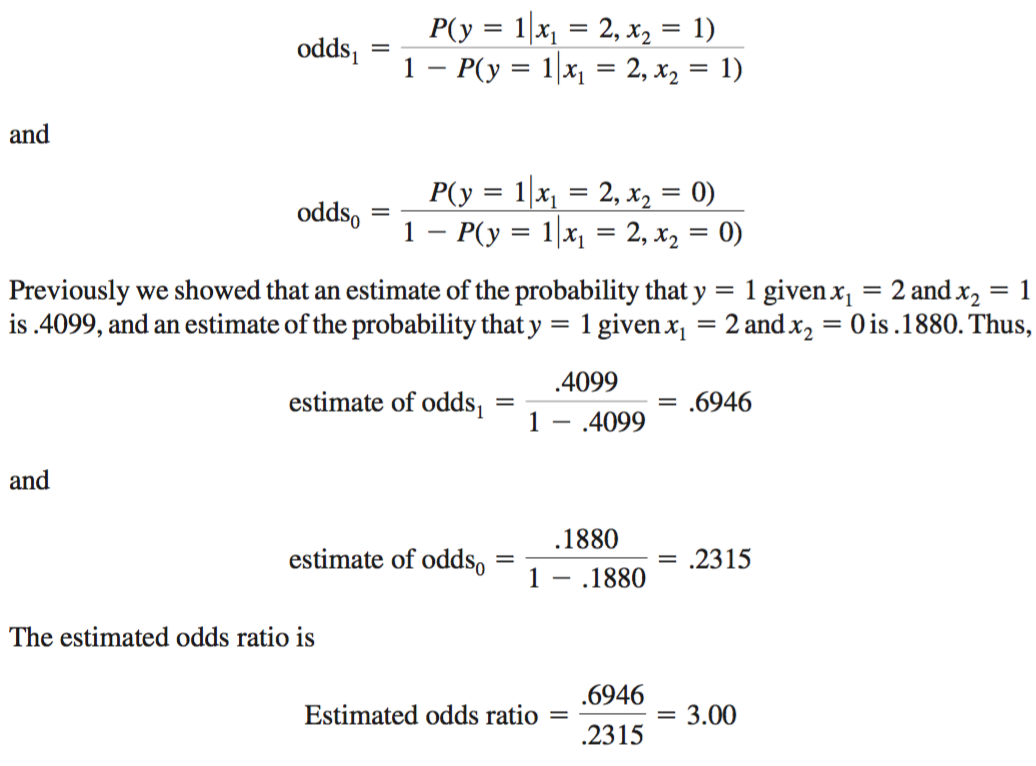
The odds in favor of an event occurring is defined as the probability the event will occur divided by the probability the event will not occur.
Odds ratio: odds of a one-unit increase in only one of the independent variables.
Odds Ratio = odds1 / odds0


免责声明:本文系网络转载或改编,未找到原创作者,版权归原作者所有。如涉及版权,请联系删
 技术文档
技术文档
 推荐好文
推荐好文





 155-2731-8020