


软件

产品


系统:windows
MATLAB版本:2016b
close allclear clc %% 产生 m 个属于 [1, n] 的随机整数m = 2;n = 3;randperm(n, m); %% 产生指定数值(默认 -1 和 1)分布的随机数,可指定元素分布概率randsrc(10, 10, [-3 -1 1 3; 0.1 0.4 0.4 0.1]); %% 产生指定范围的随机数unifrnd(0, 1:5); %% 产生均值为 0.1 方差为 0.1 的随机数x = 0.1 + sqrt(0.1)*randn(10000, 1); %% 产生 3 个和为 1 的随机数r = rand(3, 1);r = r / sum(r); %% 生成相同的随机数s = rng;x = rand(1,5);rng(s);y = rand(1,5); % 每次运行得到相同的结果% 在使用随机数之前设置rng('default'); %% 添加噪声y = x + rand(length(x), 1);y = x + randn(length(x), 1)close allclear clc %% 直接分割regexp('Numbers = 2500', '=', 'split') %% 分割得到 cell,需要二次处理textscan('Numbers = 2500', '%s %d', 'Delimiter', '=')y = (x - mean(x)) ./ std(x);[y, mu, sigma] = zscore(x);x = 1:10;y1 = x + rand(1, 10);p = polyfit(x, y1, 1);y2 = polyval(p, x);R2 = sumsqr(y2 - mean(y1)) / sumsqr(y1 - mean(y1))% 相对 Figure 位置% Button down function: UIFigurefunction UIFigureButtonDown(app, event) pos = get(app.UIFigure, 'CurrentPoint') pos app.UIFigure.CurrentPointend % 相对 Axes 位置% Button down function: UIAxesfunction UIAxesButtonDown(app, event) pt = app.UIAxes.CurrentPoint; x = pt(1, 1) y = pt(1, 2)end % 鼠标按键% normal:左键;alt:右键;extend:中键;open:双击,会触发两次单击% Button down function: UIFigurefunction UIFigureButtonDown(app, event) button = get(app.UIFigure, 'SelectionType')endclear; clc;x = linspace(0, 2*pi, 20);y = sin(x);plot(x, y);% 把 y 值复制到剪切板clipboard('copy', y);% 获取剪切板内容str = clipboard('paste')% 把当前 figure 复制到剪切板hgexport(gcf, '-clipboard')web('https://www.zhihu.com/people/1105936347')% 单颜色c = uisetcolor([0.6 0.8 1])% 色条cmap = uisetcolormapsyms uf = sym('3');Eq = sin(f)*u^2 + u + f;sol = solve(Eq, u)sol_num = double(sol)sol_num = vpa(sol)% 符号替换数字sol = subs(sol, f, 3)% 动态脚本输出,直接复制到公式编辑器
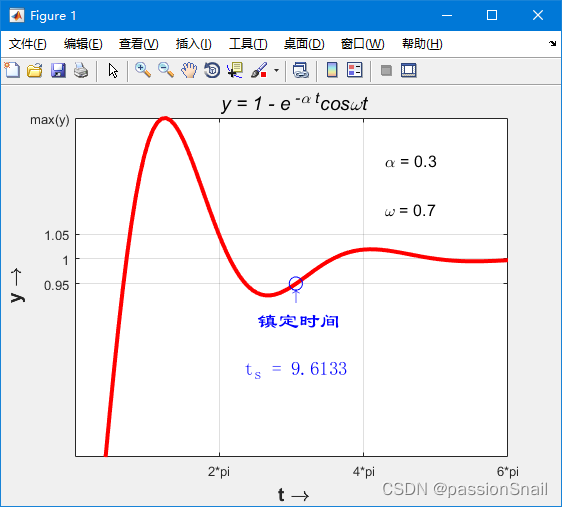
syms xf = taylor(x*exp(x), x, 'order', 9)% 复制输出字符串到公式编辑器latex(f)load、savedlmread、dlmwritecsvread、csvwriteimportdatatextscanfprintfreadtable、writetablefplotfimplicitfimplicit3fsurfisosurfaceclose allclear; clc; %% t = 6*pi*(0 : 100) / 100;y = 1 - exp(- 0.3*t) .* cos(0.7*t);plot(t, y, 'r-', 'LineWidth', 3) %%hold ontt = t(abs(y - 1) > 0.05);ts = max(tt);plot(ts, 0.95, 'bo', 'MarkerSize', 10) %%hold offaxis([-inf, 6*pi, 0.6, inf])set(gca, 'Xtick', [2*pi, 4*pi, 6*pi], 'Ytick', [0.95, 1, 1.05, max(y)])set(gca, 'XtickLabel', {'2*pi'; '4*pi'; '6*pi'})set(gca, 'YtickLabel', {'0.95'; '1'; '1.05'; 'max(y)'})grid ontext(13.5, 1.2, '\fontsize{12}{\alpha} = 0.3')text(13.5, 1.1, '\fontsize{12}{\omega} = 0.7')cell_string{1} = '\fontsize{12}\uparrow';cell_string{2} = '\fontsize{16} \fontname{隶书}镇定时间';cell_string{3} = '\fontsize{6} ';cell_string{4} = ['\fontsize{14}\rmt_{s} = ' num2str(ts)];text(ts, 0.85, cell_string, 'Color', 'b', 'HorizontalAlignment', 'Center')title('\fontsize{14}\it y = 1 - e^{ -\alpha t}cos{\omegat}')xlabel('\fontsize{14} \bft \rightarrow')ylabel('\fontsize{14} \bfy \rightarrow')
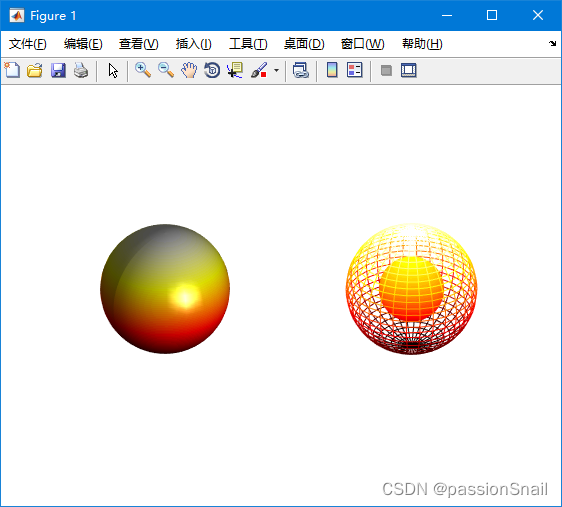
close allclear; clc; %% 光照[X, Y, Z] = sphere(40);colormap(jet)subplot(1, 2, 1)surf(X, Y, Z)axis equal offshading interplight ('position', [0 -10 1.5], 'style', 'infinite')lighting phongmaterial shinysubplot(1, 2, 2)surf(X, Y, Z, -Z)axis equal offshading flatlightlighting flatlight('position', [-1, -1, -2], 'color', 'y')light('position', [-1, 0.5, 1], 'style', 'local', 'color', 'w')set(gcf, 'Color', 'w') %% 镂空clear; clc; [X0, Y0, Z0] = sphere(30);X = 2*X0;Y = 2*Y0;Z = 2*Z0;surf(X0, Y0, Z0);shading interphold onmesh(X,Y,Z)colormap(hot)hold offhidden offaxis equalaxis off
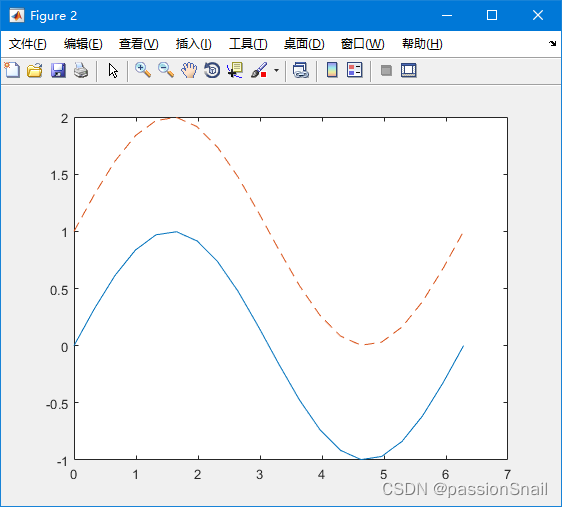
limit = axisxlim = get(gca, 'xLim')ylim = get(gca, 'YLim')% 查找 figureclear; clc; close all;x = linspace(0, 2*pi, 20);y = sin(x);figure(1)plot(x, y);figure(2)plot(x, y, x, y + 1, '--');figs = findobj('Type', 'figure') % 查找线型为 '--' 的线lines = findobj('Type', 'line', 'LineStyle', '--')
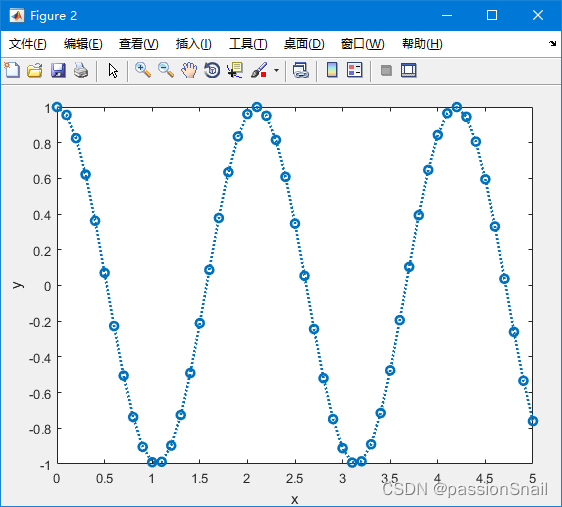
fprintf('%07.4f\n', 2.334)% 02.3340fprintf('%07d\n', 2)% 0000002num2str(5.5, '%07.4f')% ans = '05.5000'num2str(5.5, '%06.4f')% ans = '5.5000'num2str(2, '%06d')% ans = '000002'set(gca, 'xlim', [0 10e4]);set(gca, 'xlim', [0 10e5]);clear;clc;[x, y, z] = peaks(30);z = z / 1000;surf(x, y, z);cb = colorbar;cb.Ruler.Exponent = -3;clear;clc;close all;x = 0 : 0.1 : 5;y1 = sin(2*x);y2 = cos(3*x);figureplot(x, y1, 'o:', 'LineWidth', 2)xlabel('x');ylabel('y');set(gca, 'looseInset', [0 0 0 0]);figureplot(x, y2, 'o:', 'LineWidth', 2)xlabel('x');ylabel('y');set(gca, 'Position', [0.1 0.1 0.85 0.85]);
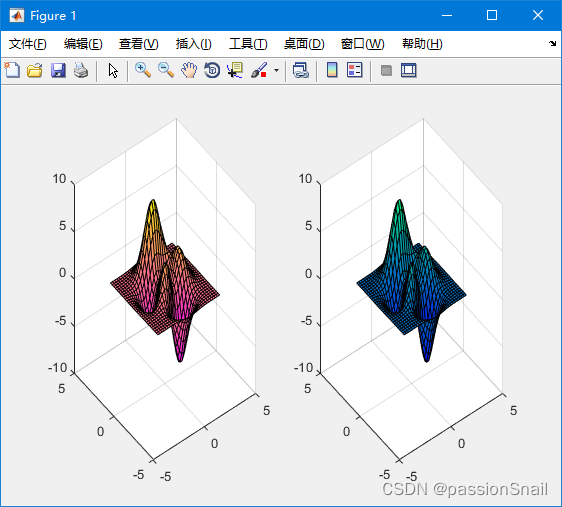
close allclear; clc; %%[x, y, z] = peaks(30);figure; %%plot1 = subplot(1,2,1);surf(x, y, z); % 设置第一幅图颜色显示为 springcolormap(plot1,spring); %% plot2 = subplot(1,2,2);surf(x, y, z);% 下面设置的是第二幅图的颜色colormap(plot2,winter);
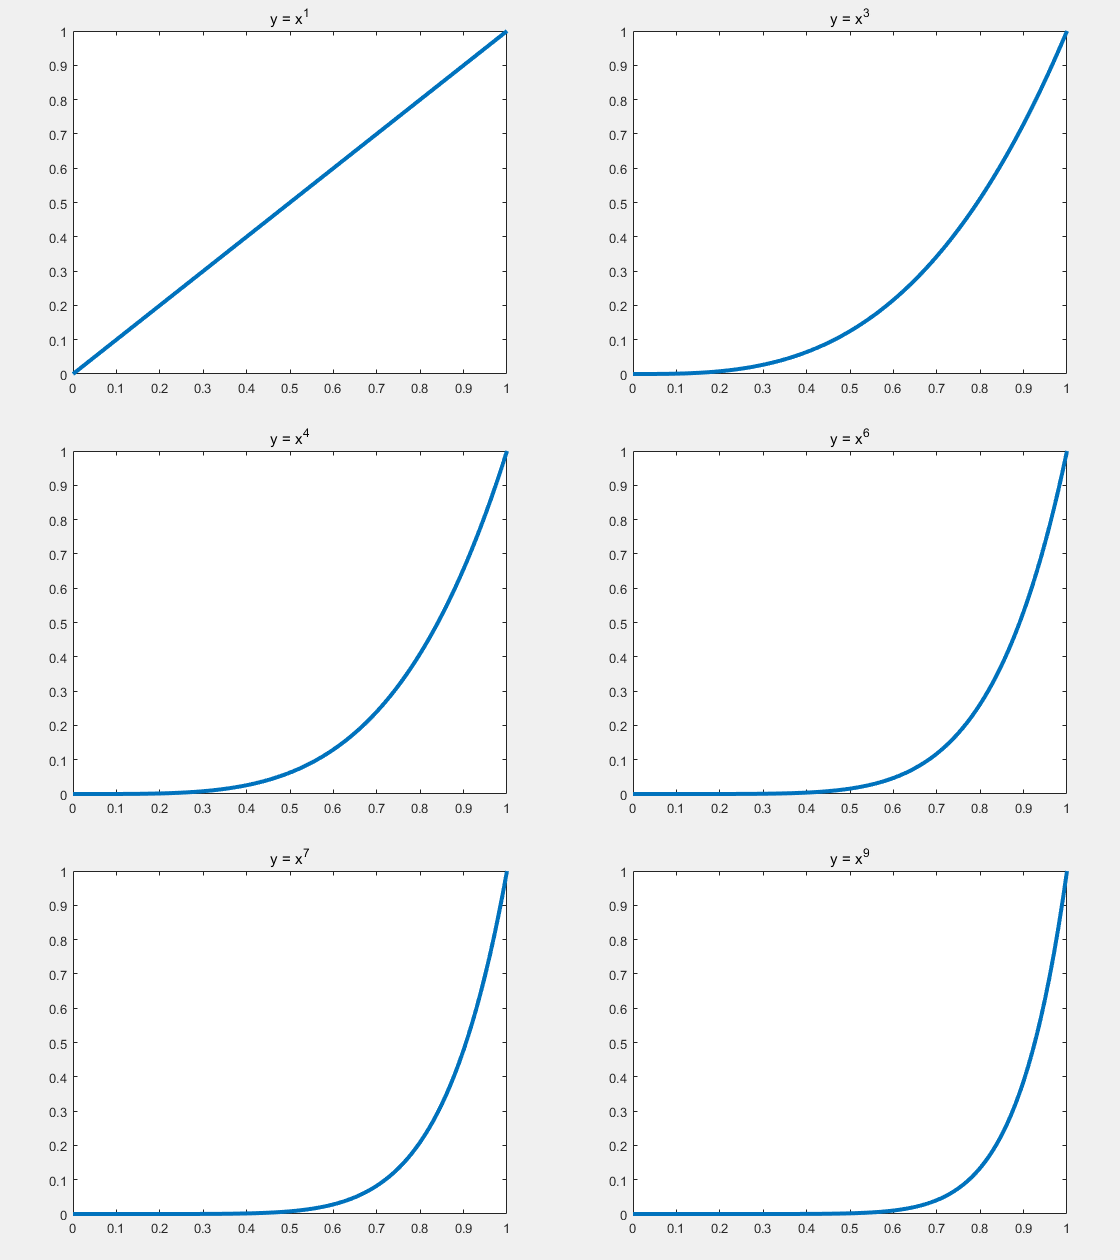
close allclear; clc; x = 0:0.01:1;n = 1:9;len = length(n);im = cell(1, len);% 单独显示每个图figure;for idx = 1:len subplot(3, 3, idx) plot(x, x.^idx, 'LineWidth',3) title(['y = x^', num2str(idx)])end% 获取绘制对象fig = figure;for idx = 1:len y = x.^idx; plot(x, y, 'LineWidth', 3) title(['y = x^', num2str(n(idx))]) % drawnow % pause(0.1); frame = getframe(fig); im{idx} = frame2im(frame);end% 输出文件名filename = 'testAnimated.gif';for idx = 1:len % 制作gif文件,图像必须是index索引图像 [A, map] = rgb2ind(im{idx}, 256); if idx == 1 imwrite(A, map, filename, 'gif', 'LoopCount', Inf, 'DelayTime', 0.3); else imwrite(A, map, filename, 'gif', 'WriteMode', 'append', 'DelayTime', 0.3); endend
% 读取图像clear;clc;% 保存文件名filename = 'Model.gif';% 4张图for i = 1:4 % 图片路径 fileName = [num2str(i), '.jpg']; img = imread(fileName); % 重定义尺寸 img = imresize(img, [256, 256]); imshow(img); % 不显示窗口 set(gcf, 'visible', 'off'); % 获取位置 q = get(gca, 'position'); % 设置左边距离值为零 q(1) = 0; % 设置右边距离值为零 q(2) = 0; % 重新设置位置 set(gca, 'position', q); frame = getframe(gcf, [0, 0, 200, 200]); im = frame2im(frame); imshow(im); [I, map] = rgb2ind(im, 256); if i == 1 imwrite(I, map, filename, 'gif', 'Loopcount', inf, 'DelayTime', 0.3); else imwrite(I, map, filename, 'gif', 'WriteMode', 'append', 'DelayTime', 0.3); endend

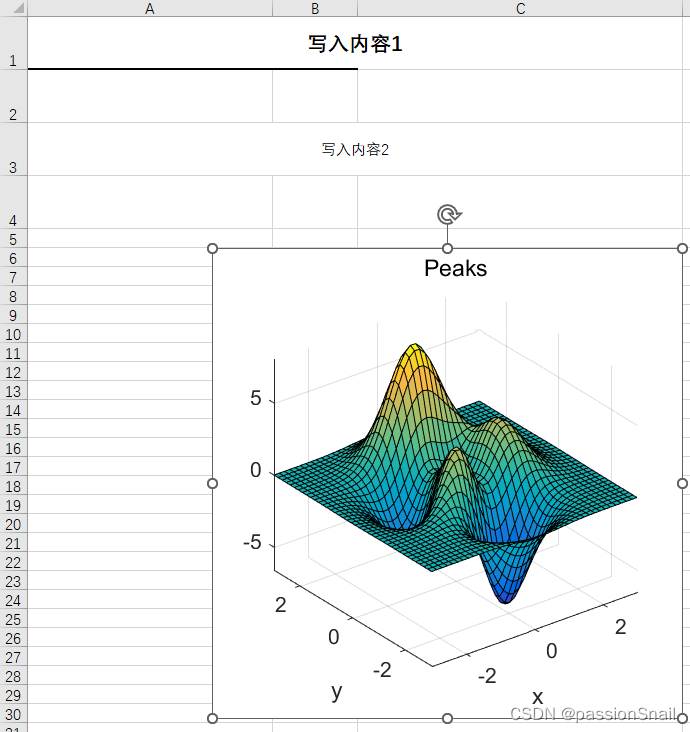
clear;clc;close all;% 获取到颜色[all_themes, all_colors] = GetColors();% 生成示例数据m = 5;n = 3;x = 1:m;y = rand(m, n) + 2;% 误差限neg = rand(m, n);pos = rand(m, n);% 单系列带有误差线的柱状图figure;bar(x, y(:, 1));hold onerrorbar(x, y(:, 1), neg(:, 1), pos(:, 1), 'LineStyle', 'none', 'Color', 'k', 'LineWidth', 2);hold off% 多系列带有误差线的柱状图figure;% 绘制柱状图h = bar(x, y);% 设置每个系列颜色for i = 1:length(h) h(1, i).FaceColor = all_colors(i, :);end% 单独设置第二个系列第二个柱子颜色% 这行代码少不了h(1, 2).FaceColor = 'flat';h(1, 2).CData(2,:) = all_colors(6, :); % 获取误差线 x 值 % 也就是 XEndPoints 的值xx = zeros(m, n);for i = 1 : n xx(:, i) = h(1, i).XEndPoints'; end% 绘制误差线hold onerrorbar(xx, y, neg, pos, 'LineStyle', 'none', 'Color', 'k', 'LineWidth', 2);hold off% 绘制图例legend({'A1', 'A2', 'A3'});% 设置 x 轴标签set(gca, 'XTickLabel', {'label1', 'label2', 'label3', 'label4', 'label5'});% 试试 barwebfigure;barweb(y, neg, 1, {'label1', 'label2', 'label3', 'label4', 'label5'});clear;clc;% 设置文件保存路径filepath = [pwd, '\test.xlsx']; % 检查 Excel 是否已经打开try % 若 Excel 服务器已经打开,返回其句柄 excel = actxGetRunningServer('Excel.Application');catch % 创建一个Microsoft Excel 服务器 excel = actxserver('Excel.Application'); end% 设置 excel 属性为可见,0表示不可见% set(excel, 'Visible', 1);excel.Visible = 0; % 取消保存提示excel.DisplayAlerts = false; % 检查文件是否存在if exist(filepath, 'file') workbook = excel.Workbooks.Open(filepath); % workbook = invoke(excel.Workbooks, 'Open', filepath);else workbook = excel.Workbooks.Add; % workbook = invoke(excel.Workbooks, 'Add'); workbook.SaveAs(filepath);end% 当前工作表句柄sheets = excel.ActiveWorkbook.Sheets; % sheets = workbook.Sheets;% 返回第1个Sheet句柄sheet1 = sheets.Item(1);% 激活第1个表格sheet1.Activate; % 修改第1个Sheet的名字sheet1.Name = 'test sheet1'; % 页面设置% 上边距5磅sheet1.PageSetup.TopMargin = 5; % 下边距10磅sheet1.PageSetup.BottomMargin = 10; % 左边距15磅sheet1.PageSetup.LeftMargin = 15; % 右边距20磅sheet1.PageSetup.RightMargin = 20; % 设置行高和列宽% 定义行高向量RowHeightsheet1.Range('A1:A4').RowHeight = [40, 20, 40, 20];sheet1.Range('A1:C1').ColumnWidth = [30, 10, 40, 20];% 合并单元格sheet1.Range('A1:C1').MergeCells = 1;sheet1.Range('A3:C3').MergeCells = 1;% 设置单元格的边框sheet1.Range('A1:B1').Borders.Weight = 3;sheet1.Range('A4:C4').Borders.Item(3).Linestyle = 0;sheet1.Range('A4:C4').Borders.Item(4).Linestyle = 0;% 设置单元格对齐方式sheet1.Range('A1:B3').HorizontalAlignment = 3;sheet1.Range('C1:C3').VerticalAlignment = 1;% 写入单元格内容sheet1.Range('A1').Value = '写入内容1';sheet1.Range('A3').Value = '写入内容2';% 设置字号sheet1.Range('A1:B3').Font.size = 11; sheet1.Range('A1').Font.size = 16; sheet1.Range('A1').Font.bold = 2; % 如果当前工作文档中有图形存在,通过循环将图形全部删除shape = sheet1.Shapes; % 返回文档中Shape对象的个数shapeCount = shape.Count; % while shapeCount > 0% shape.Item(1).Delete; % endif shapeCount ~= 0 for i = 1 : shapeCount shape.Item(1).Delete; endend% 插入图形% 生成一个Figurefig = figure;% 设置 fig 尺寸且不可见set(fig, 'Position', [400, 400, 300, 300], 'visible', 'off')% z = peaks(40); % 这么写图片空白peaks(40); % 图形复制hgexport(fig, '-clipboard');% 图形粘贴% 选中 sheet1 的 D3 单元格,插入直方图sheet1.Range('D3').Select;sheet1.Paste; % sheet1.PasteSpecial;% 删除图形句柄delete(fig); % 保存文档workbook.Save; workbook.Close;excel.Quit;
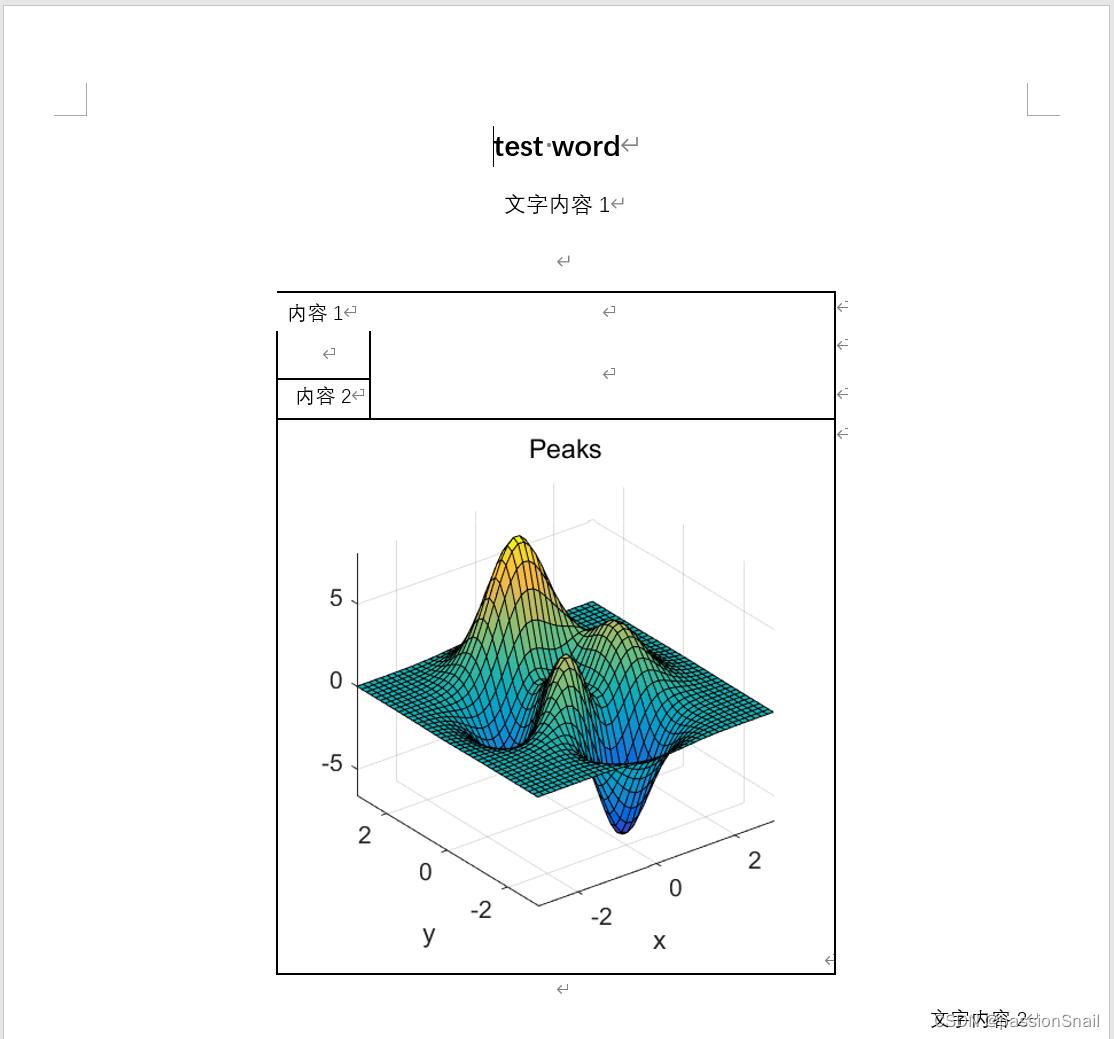
clear;clc;% Matlab 操作 Word 文档% 设置文件保存路径filepath = [pwd, '\test.docx']; % 检查 Word 是否已经打开try % 若 Word 服务器已经打开,返回其句柄 word = actxGetRunningServer('Word.Application');catch % 创建一个Microsoft Word服务器 word = actxserver('Word.Application'); end% 设置 word 属性为可见,0表示不可见% set(word, 'Visible', 1);word.Visible = 1; % 检查文件是否存在if exist(filepath, 'file') document = word.Documents.Open(filepath); else document = word.Documents.Add; document.SaveAs2(filepath);end% 句柄获取content = document.Content;selection = word.Selection; paragraphFormat = selection.ParagraphFormat; % 页面设置% 上边距60磅document.PageSetup.TopMargin = 60; % 下边距45磅document.PageSetup.BottomMargin = 45; % 左边距45磅document.PageSetup.LeftMargin = 45; % 右边距45磅document.PageSetup.RightMargin = 45; % 标题content.Text = 'test word';% 设置文档内容的起始位置content.Start = 0; % 设置字号为16content.Font.Size = 16 ; % 字体加粗content.Font.Bold = 4 ; % 居中对齐content.Paragraphs.Alignment = 'wdAlignParagraphCenter'; % 设置下面内容的起始位置selection.Start = content.end; % 回车,另起一段selection.TypeParagraph; % 在当前位置输入文字内容selection.Text = '文字内容1'; % 设置字号为12selection.Font.Size = 12; % 字体不加粗selection.Font.Bold = 0; % 光标下移(取消选中)selection.MoveDown; % 居中对齐paragraphFormat.Alignment = 'wdAlignParagraphCenter'; selection.TypeParagraph; selection.TypeParagraph; selection.Font.Size = 11; % 在光标所在位置插入一个 4 行 3 列的表格tables = document.Tables.Add(selection.Range, 4, 3); % 返回第1个表格的句柄table = tables;% table = document.Tables.Item(1); % 设置表格边框table.Borders.OutsideLineStyle = 'wdLineStyleSingle';table.Borders.OutsideLineWidth = 'wdLineWidth150pt';table.Borders.InsideLineStyle = 'wdLineStyleSingle';table.Borders.InsideLineWidth = 'wdLineWidth150pt';table.Rows.Alignment = 'wdAlignRowCenter';table.Rows.Item(2).Borders.Item(1).LineStyle = 'wdLineStyleNone';% 设置表格列宽和行高columnWidth = [50, 50, 200]; rowHeight = [20, 25, 20, 200]; for i = 1 : 3 table.Columns.Item(i).Width = columnWidth(i);end% 设置表格的行高for i = 1 : 4 table.Rows.Item(i).Height = rowHeight(i);end% 设置每个单元格的垂直对齐方式for i = 1 : 4 for j = 1 : 3 table.Cell(i,j).VerticalAlignment = 'wdCellAlignVerticalCenter'; endend% 合并单元格table.Cell(1, 2).Merge(table.Cell(1, 3));table.Cell(2, 2).Merge(table.Cell(3, 3));table.Cell(4, 1).Merge(table.Cell(4, 3));selection.Start = content.end; selection.TypeParagraph; selection.Text = '文字内容2'; % 右对齐paragraphFormat.Alignment = 'wdAlignParagraphRight'; selection.MoveDown; % 写入表格内容table.Cell(1, 1).Range.Text = '内容1';table.Cell(3, 1).Range.Text = '内容2';table.Cell(1, 1).Range.ParagraphFormat.Alignment = 'wdAlignParagraphLeft';table.Cell(3, 1).VerticalAlignment = 'wdCellAlignVerticalTop';table.Cell(1, 1).Borders.Item(2).LineStyle = 'wdLineStyleNone';table.Cell(1, 1).Borders.Item(4).LineStyle = 'wdLineStyleNone';% 如果当前工作文档中有图形存在,通过循环将图形全部删除shape = document.Shapes; % 返回文档中Shape对象的个数shapeCount = shape.Count; if shapeCount ~= 0 for i = 1 : shapeCount shape.Item(1).Delete; endendfig = figure;% 设置 fig 尺寸且不可见set(fig, 'Position', [400, 400, 300, 300], 'visible', 'off')% z = peaks(40); % 这么写图片空白peaks(40); % 图形复制hgexport(fig, '-clipboard');% 图形粘贴% Selection.Range.PasteSpecial;table.Cell(8,1).Range.Paragraphs.Item(1).Range.Paste;% 删除图形句柄delete(fig); % 设置视图方式为页面document.ActiveWindow.ActivePane.View.Type = 'wdPrintView'; % 保存文档document.Save; document.Close;word.Quit;
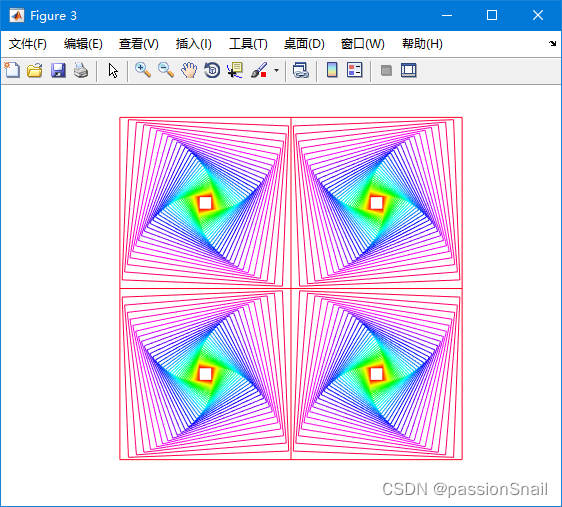
clear;clc;% 创建一个典型的病态矩阵:Hilbert矩阵N = 15;a = repmat(1:N, N, 1);A = 1 ./ (a + a' - 1);cd = cond(A);% 输出条件数disp(cd);rng('default');% 随机生成一组解x = rand(N,1);% 生成常数项y = A*x;% 左除x0 = A\y;y0 = A*x0;% SVD分解[u,s,v] = svd(A);% 方法一:去掉极小奇异值lemt = 1e-7;s1 = diag(1 ./ s(s > lemt));s1(N,N) = 0;x1 = v*s1*u'*y;y1 = A*x1;% 方法二:添加正则项s2 = diag(1./(diag(s)+lemt*ones(N,1)));x2 = v*s2*u'*y;y2 = A*x2;% 结果比较:disp([x, x0, x1, x2]);disp([y, y0, y1, y2]);clear;clc;close all;m = 3;n = 41;d_angle = 2.25;rotate = 45;shift = [0, 0];figureSpiralPolygon(m, n, d_angle, rotate, shift); m = 4;figureSpiralPolygon(m, n, d_angle, rotate, shift); figure;V = SpiralPolygon(m, n, -d_angle, rotate, shift);hold ondx = max(V(1, :)) - min(V(1, :));dy = max(V(2, :)) - min(V(2, :));shift = [dx, 0];SpiralPolygon(m, n, d_angle, rotate, shift);shift = [dx, dy];SpiralPolygon(m, n, -d_angle, rotate, shift);shift = [0, dy];SpiralPolygon(m, n, d_angle, rotate, shift);hold off function V = SpiralPolygon(m, n, d_angle, rotate, shift)th = linspace(0, 360, m + 1) + rotate;V = [cosd(th); sind(th)];C = colormap(hsv(n));scale = sind(150 - abs(d_angle))/sind(30);R = Rot2(d_angle);% hold offfor i = 1:nif i > 1V = scale * R * V;endplot(V(1,:) + shift(1), V(2,:) + shift(2), 'Color', C(i,:));hold onendset(gcf, 'Color', 'w');axis equalaxis offend function R = Rot2(theta)theta = theta*pi/180;R = [cos(theta), -sin(theta); sin(theta), cos(theta)];end


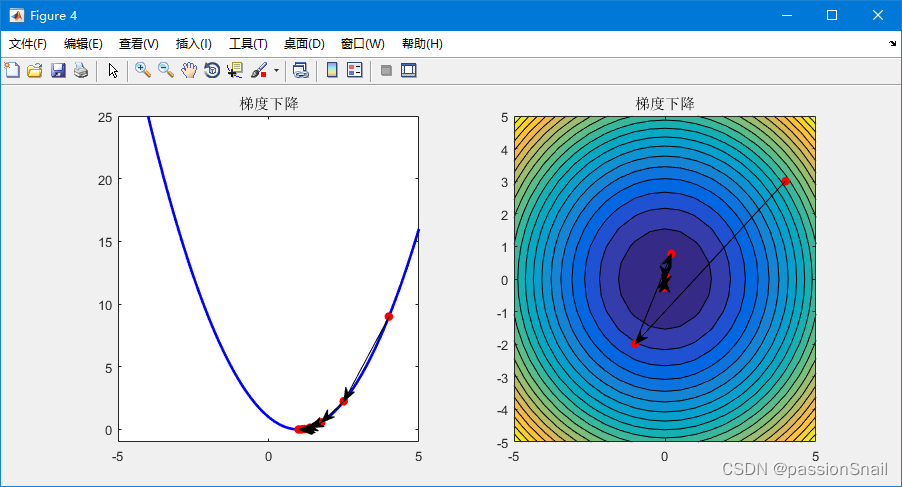
clear;clc;%% 一元函数梯度下降法% 示例:f(x) = min{(x - 1)^2}% 梯度:g(x) = 2 * (x - 1)yita = 0.25; % 学习率,一般设置小一点,否则容易在最小值附近震荡或者不收敛x1 = -5 : 0.1 : 5;y1 = (x1 - 1).^2;iteMax = 1000;xInit = 4;yInit = (xInit - 1)^2;err = 1e-6;figure('Position', [50, 50, 900, 400]);subplot(1, 2, 1)plot(x1, y1, 'b', 'LineWidth', 2)xlim([-5, 5])ylim([-1, 25])hold onplot(xInit, yInit, 'or', 'MarkerFaceColor', 'r')for i = 1 : iteMax % x = x + yita * grad; xNew = xInit - yita * 2 * (xInit - 1); yNew = (xNew - 1)^2; % 退出条件 if abs(xNew - xInit) < err break; else PlotLineArrow(gca, [xInit, xNew], [yInit, yNew], 'r', 'k') xInit = xNew; yInit = yNew; disp(['第', num2str(i), '次迭代结果:', num2str(xInit)]); plot(xNew, yNew, 'or', 'MarkerFaceColor', 'r') endendhold offtitle('梯度下降'); %% 多元函数梯度下降法% 示例:f(x) = min{x1^2 + x2^2}% 梯度:g(x) = [2 * x1; 2 * x2][x, y] = meshgrid(-5:0.5:5, -5:0.5:5);z = x.^2 + y.^2;initX = 4;initY = 3;initZ = initX^2 + initY^2;initValue = [initX; initY];subplot(1, 2, 2)contourf(x, y, z, 20);shading interphold ongrad = zeros(1, 2);e = 0.1;yita = 5; % Adagrad 更快收敛for i = 1 : iteMax % 标准的梯度法 x = x + yita * grad;% newValue = initValue - yita * [2 * initX; 2 * initY]; % Adagrad 法 x = x + yita * inv(G) * grad; grad = grad + [(2 * initX)^2, (2 * initY)^2]; newValue = initValue - yita * diag(1 ./ sqrt(grad + e)) * [2 * initX; 2 * initY]; % 退出条件 if norm(newValue - initValue) < err break; else newX = newValue(1); newY = newValue(2); newZ = newX^2 + newY^2;% plot([initX, newX], [initY, newY], '-ok', 'MarkerFaceColor', 'r') PlotLineArrow(gca, [initX, newX], [initY, newY], 'r', 'k') initValue = newValue; initX = newX; initY = newY; initZ = newZ; disp(['第', num2str(i), '次迭代结果:', num2str(newValue')]); endendhold offtitle('梯度下降'); function PlotLineArrow(obj, x, y, markerColor, lineColor)% 绘制带箭头的曲线% 绘制散点图plot(x, y, 'o', 'Color', markerColor', 'MarkerFaceColor', markerColor);% 获取 Axes 位置posAxes = get(obj, 'Position');posX = posAxes(1);posY = posAxes(2);width = posAxes(3);height = posAxes(4);% 获取 Axes 范围limX = get(obj, 'Xlim');limY = get(obj, 'Ylim');minX = limX(1);maxX = limX(2);minY = limY(1);maxY = limY(2);% 转换坐标xNew = posX + (x - minX) / (maxX - minX) * width;yNew = posY + (y - minY) / (maxY - minY) * height;% 画箭头annotation('arrow', xNew, yNew, 'color', lineColor);end
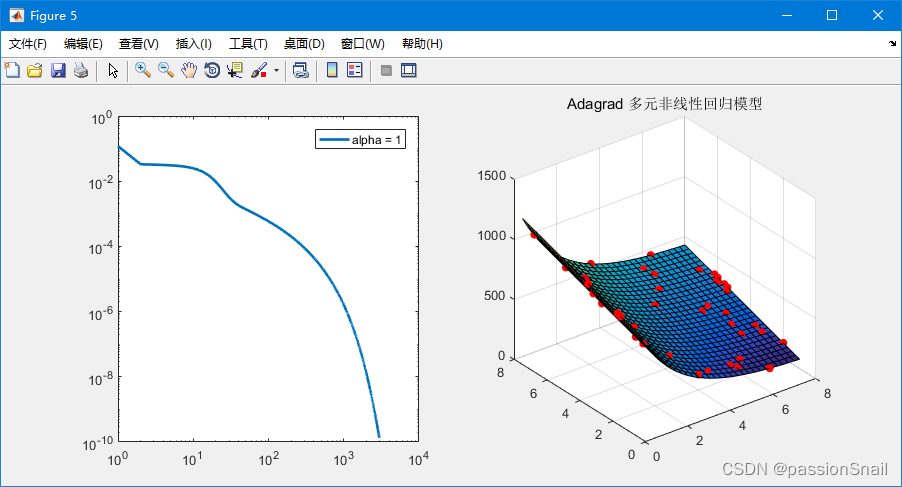
clear; clc;% z = w1 * exp(-x / w2) + w3 * y + w4% z = 900 * exp(-x / 2) + 50 * y + 10len = 40;rng('default');x = randi(len + 1, len, 1) / 5;y = randi(len + 1, len, 1) / 5;z = 900 * exp(-x / 2) + 50 * y + 10;maxi = max(z);z = z / maxi;ratio = 0.0;z = z + ratio * max(z) * rand(len, 1);X = [x, y];fun = @(var, X)var(1) * exp(-X(:, 1) / var(2)) + var(3) * X(:, 2) + var(4);w = lsqcurvefit(fun, [1, 1, 1, 1], X, z);w([1, 3, 4]) = maxi * w([1, 3, 4]);disp(['lsqcurvefit 计算结果:', num2str(w)]);% 梯度下降法学习% obj = 1 / (2 * len) * (w1 * exp(-x / w2) + w3 * y + w4 - z)' * (w1 * exp(-x / w2) + w3 * y + w4 - z)alpha = 1; % 学习率大收敛快,可能有震荡iteMax = 10000;w1 = 1;w2 = 1;w3 = 1;w4 = 1;initW = [w1; w2; w3; w4];err = 1e-6;J = zeros(iteMax, 1);G = zeros(size(initW));e = 0.1;for i = 1 : iteMax% gradW1 = 1 / len * (exp(-x / w2))' * (w1 * exp(-x / w2) + w3 * y - z);% gradW2 = 1 / len * (w1 * x .* exp(-x / w2) / w2^2)' * (w1 * exp(-x / w2) + w3 * y - z);% gradW3 = 1 / len * y' * (w1 * exp(-x / w2) + w3 * y - z);% grad = [gradW1; gradW2; gradW3]; gradW1 = exp(-x / w2); gradW2 = w1 * x .* exp(-x / w2) / w2^2; gradW3 = y; gradW4 = ones(len, 1); grad = 1 / len * [gradW1, gradW2, gradW3, gradW4]' * (w1 * exp(-x / w2) + w3 * y + w4 - z); % Adagrad 法 x = x + yita * inv(G) * grad; G = G + grad.^2; newW = initW - alpha * diag(1 ./ sqrt(G + e)) * grad; if norm(newW - initW) < err J(i + 1 : end) = []; disp(['梯度下降法迭代次数:', num2str(i)]); newW([1, 3, 4]) = maxi * newW([1, 3, 4]); disp(['梯度下降法迭代结果:', num2str(newW')]); break; else initW = newW; w1 = newW(1); w2 = newW(2); w3 = newW(3); w4 = newW(4); J(i) = 1 / (2 * len) * (w1 * exp(-x / w2) + w3 * y + w4 - z)' * (w1 * exp(-x / w2) + w3 * y + w4 - z); endend% 绘图figure('Position', [50, 50, 900, 400]);subplot(1, 2, 1)loglog(J, 'LineWidth', 2)legend(['alpha = ', num2str(alpha)]);xFit1 = linspace(min(x), max(x), 30);yFit1 = linspace(min(y), max(y), 30);[xFit2, yFit2] = meshgrid(xFit1, yFit1);zFit = w1 * exp(-xFit2 / w2) + w3 * yFit2 + w4;zFit = maxi * zFit;z = maxi * z;subplot(1, 2, 2)scatter3(x, y, z, 'r', 'filled');hold onsurf(xFit2, yFit2, zFit);hold offtitle('Adagrad 多元非线性回归模型');
close allclear; clc;format long;%% 数值积分% sample 1fun1 = @(x) sin(x);result = integral(fun1, 0, pi);fprintf('result=%s\n',result);% result = 2.000000000000000 % sample 2fun2 = @(x) sin(x) ./ x;result = integral(fun2, 0, 1);fprintf('result=%s\n',result);% result = 0.946083070367183 %% 解析解syms x t% sample 3y1 = sin(x);f1 = int(y1, x, 0, t);fprintf('f1=%s\n',f1); % sample 4y2 = sin(x) / x;f2 = int(y2, x, 0, t);fprintf('f2=%s\n',f2); f2_val = double(subs(f2, t, 1));% f2_val = 0.946083070367183;f3 = MyIntegral1(fun2, 0, 1, 10000);fprintf('f3=%s\n',f3);% f3 = 0.946083070492669 function result = MyIntegral1(fun, minX, maxX, intervalCount)% fun: 函数句柄% minX: 积分下限% maxX: 积分上限% intervalCount: 积分区间份数% 利用积分的定义来求面积result = 0;h = (maxX - minX) / intervalCount; % 步长for i = 1 : intervalCount result = result + h * fun(minX + (i - 0.5) * h); % 采用简单矩形公式:面积 = 底 × 高endendclear;clc;% 获取路径下所有 png 文件信息all_images = dir('https://www.gofarlic.com\MyPrograms\DataSet\halcon\*.png')% 图片数量image_num = size(all_images, 1)% 遍历图像for i = 1 : image_num folder = all_images(i).folder name = all_images(i).name fullname = fullfile(folder, name)end
编程过程中经常遇到判断两个浮点数是否相等的情况,此时如果直接用 a == b 来做判断,会导致意想不到的错误,肉眼可见判断为 true,但是程序给你判断为 false,原因在于浮点数在计算机里存储会有一定的精度误差,可采用简单方法:
% 判定为相等if abs(a - b) < eps end% 用 cell 类型ylabel({'Normalized'; 'optical intensity'});
免责声明:本文系网络转载或改编,未找到原创作者,版权归原作者所有。如涉及版权,请联系删
 技术文档
技术文档
 推荐好文
推荐好文





 155-2731-8020