


软件

产品


| X | 1 | 1.1 | 1.2 | 1.3 | 1.4 |
| y | 1.00000 | 1.23368 | 1.55271 | 1.99372 | 2.61170 |
利用几种插值方法对其进行插值,得到每隔0.05的结果。
编写脚本文件,文件内容为:
% Interpolation using the four methodsx=[1 1.1 1.2 1.3 1.4];y=[1.00000 1.23368 1.55271 1.99372 2.61170];length_of_x=length(x);scalar_x=x(1):0.05:x(length_of_x);%每隔0.05取点然后存到sclar_x中length_of_sx=length(scalar_x);y_nearest = zeros(length(scalar_x),1);y_linear = zeros(length(scalar_x),1);y_spline = zeros(length(scalar_x),1);y_cubic = zeros(length(scalar_x),1);%创建0阶矩阵for i=1:length_of_sx y_nearest(i)=interp1(x,y,scalar_x(i),'nearest');%邻近点插值 y_linear(i) =interp1(x,y,scalar_x(i),'linear');%线性插值 y_spline(i) =interp1(x,y,scalar_x(i),'spline');%三次样条插值 y_cubic(i) =interp1(x,y,scalar_x(i),'cubic');%立方插值endsubplot(2,2,1),plot(x,y,'*'),hold on,plot(scalar_x,y_nearest),title('method=nearest');subplot(2,2,2),plot(x,y,'*'),hold on,plot(scalar_x,y_linear),title('method=linear');subplot(2,2,3),plot(x,y,'*'),hold on,plot(scalar_x,y_spline),title('method=spline');subplot(2,2,4),plot(x,y,'*'),hold on,plot(scalar_x,y_cubic),title('method=cubic');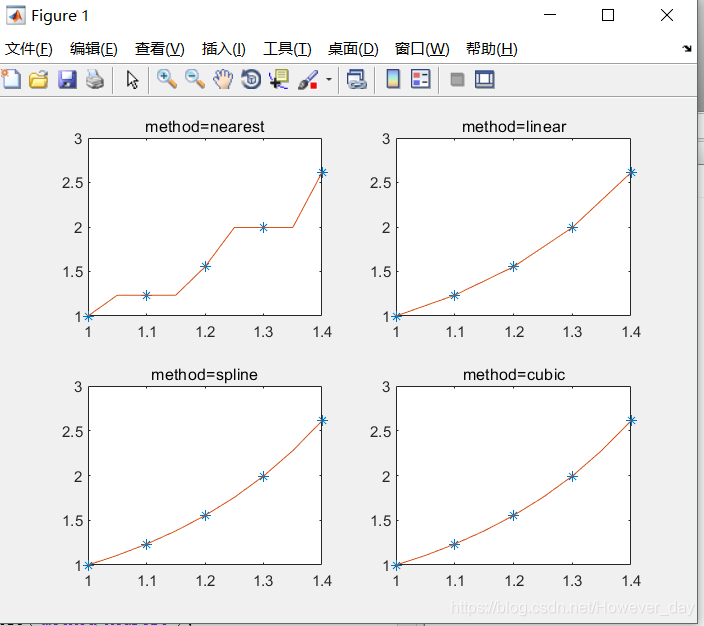
plot(x,y,'*')就是在x,y点画* 的意思 技术文档
技术文档
 推荐好文
推荐好文


 155-2731-8020


