


软件

产品


legend 除了常用的文字参数外,还可以加 'location' 的参数,可以调整图例说明的位置~
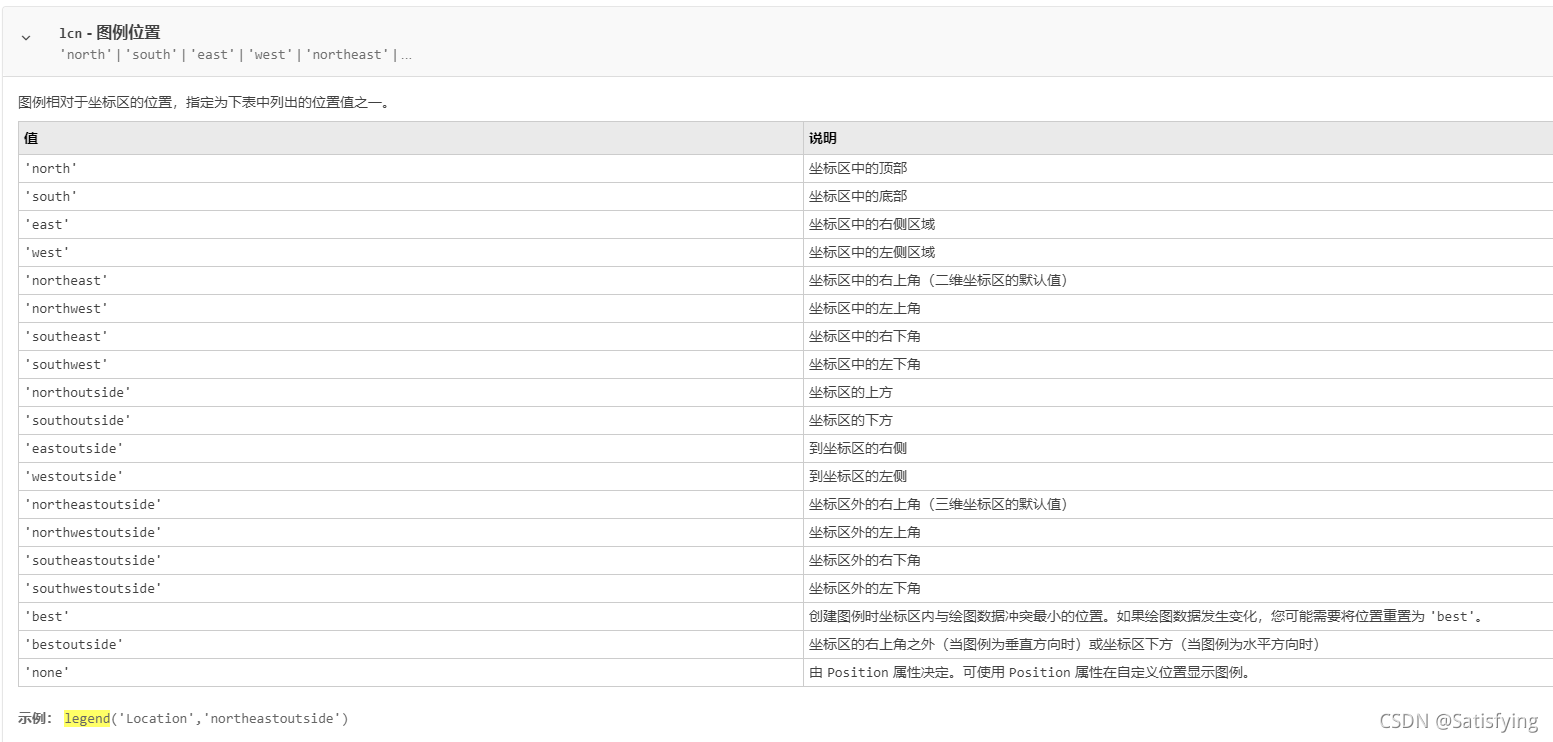
(图片来源:legend)
fs = 1000; % 采样频率t = 0 : 1/fs : 1; % 信号时间轴f1 = 10; % 信号频率s = 10 * sin(2*pi*f1*t); % 信号s figure(1);subplot(2, 2, 1);plot(s, 'linewidth', 1.2); legend('s的曲线', 'location', 'north');subplot(2, 2, 2);plot(s, 'linewidth', 1.2); legend('s的曲线', 'location', 'west');subplot(2, 2, 3);plot(s, 'linewidth', 1.2); legend('s的曲线', 'location', 'east');subplot(2, 2, 4);plot(s, 'linewidth', 1.2); legend('s的曲线', 'location', 'south');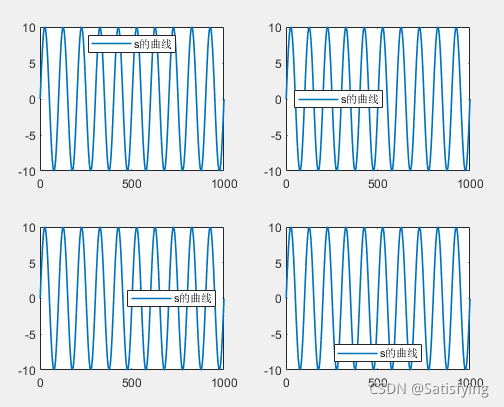
(参考: matlab 设置legend(比较全面))
免责声明:本文系网络转载或改编,未找到原创作者,版权归原作者所有。如涉及版权,请联系删
 技术文档
技术文档
 推荐好文
推荐好文


 155-2731-8020


