


软件

产品


import altair as altimport pandas as pdfrom altair.expr import datumdf_test=pd.read_csv("test_df.csv") chart_m1=alt.Chart(df_test).mark_bar().encode( x=alt.X('counts:Q', stack="normalize",axis=None), y=alt.Y('category:N',sort=['A','B','C'],title=None), color=alt.Color('grade:N', sort = alt.EncodingSortField( 'sort:Q', order = 'ascending' ), scale = alt.Scale(domain=['good <10', 'average 10-20', 'bad >20'], range=['#0cce6b', '#ffa400', '#ff4e42']), legend = alt.Legend(title="Metric1",orient='top')), order='sort:Q', tooltip=['category:N','grade:N','counts:Q'] ).transform_filter(datum.metric=='metric1' ).properties(height=50,width=150) chart_m2=alt.Chart(df_test).mark_bar().encode( x=alt.X('counts:Q', stack="normalize",axis=None), y=alt.Y('category:N',sort=['A','B','C'],title=None), color=alt.Color('grade:N', sort = alt.EncodingSortField( 'sort:Q', order = 'ascending' ), scale = alt.Scale(domain=['good <100', 'average 100-350', 'bad >350'], range=['#0cce6b', '#ffa400', '#ff4e42']), legend = alt.Legend(title="Metric2",orient='top')), order='sort:Q', tooltip=['category:N','grade:N','counts:Q'] ).transform_filter(datum.metric=='metric2' ).properties(height=50,width=150) alt.hconcat(chart_m1,chart_m2).resolve_legend(color='independent').configure_view(stroke=None)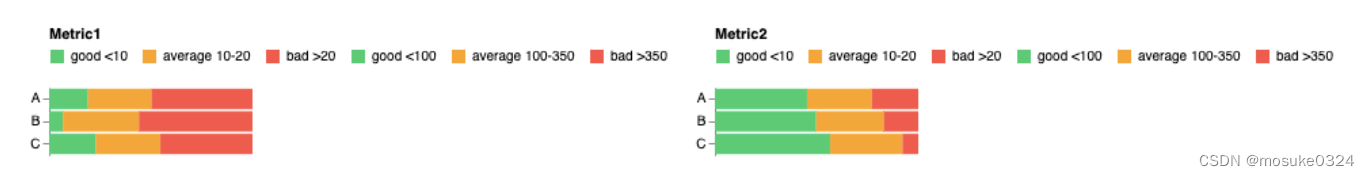
但是图例同一颜色的图例重复了,造成混淆。使用.resolve_legend(color='independent')没有用。
目标是每个图只显示跟它相关的legend,如下:
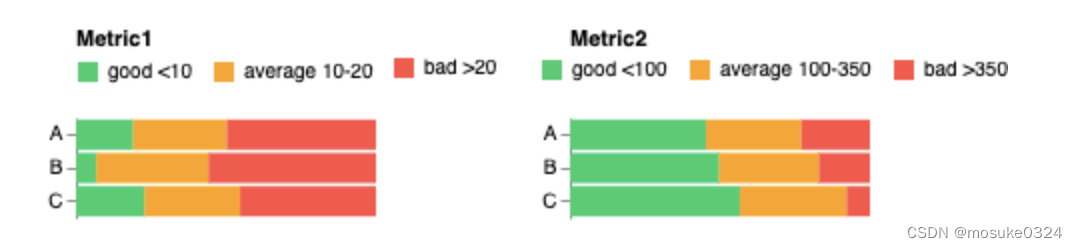
alt.hconcat( chart_m1, chart_m2).resolve_scale( color='independent').configure_view( stroke=None)来源:python - How to display two different legends in hconcat chart using altair - Stack Overflowhttps://stackoverflow.com/questions/60328943/how-to-display-two-different-legends-in-hconcat-chart-using-altair
免责声明:本文系网络转载或改编,未找到原创作者,版权归原作者所有。如涉及版权,请联系删
 技术文档
技术文档
 推荐好文
推荐好文


 155-2731-8020


