


 h =
h =
Histogram with properties:
Data: [10000x1 double]
Values: [1x37 double]
NumBins: 37
BinEdges: [1x38 double]
BinWidth: 0.2000
BinLimits: [-3.8000 3.6000]
Normalization: 'count'
FaceColor: 'auto'
EdgeColor: [0 0 0]
Show all properties
指定 histogram 函数的输出参数时,它返回一个二元直方图对象。可以使用该对象检查直方图的属性,例如 bin 数量或宽度。
计算直方图的 bin 数量。
nbins = h.NumBins
nbins = 37
2.指定直方图的 bin 数量
对分类为 25 个等距 bin 的 1,000 个随机数绘制直方图。
x = randn(1000,1);
nbins = 25;
h = histogram(x,nbins)
Histogram with properties:
Data: [1000x1 double]
Values: [1x25 double]
NumBins: 25
BinEdges: [1x26 double]
BinWidth: 0.2800
BinLimits: [-3.4000 3.6000]
Normalization: 'count'
FaceColor: 'auto'
EdgeColor: [0 0 0]
Show all properties
求 bin 计数。
counts = h.Values
counts = 1×25
1 3 0 6 14 19 31 54 74 80 92 122 104 115 88 80 38 32 21 9 5 5 5 0 2
3.更改直方图的 bin 数量
生成 1,000 个随机数并创建直方图。
X = randn(1000,1);
h = histogram(X)

Histogram with properties:
Data: [1000x1 double]
Values: [1x23 double]
NumBins: 23
BinEdges: [1x24 double]
BinWidth: 0.3000
BinLimits: [-3.3000 3.6000]
Normalization: 'count'
FaceColor: 'auto'
EdgeColor: [0 0 0]
Show all properties
使用 morebins 函数粗略调整 bin 数量。
Nbins = morebins(h);
Nbins = morebins(h)
通过显式设置 bin 数按精细颗粒级别调整 bin。
h.NumBins = 31;

生成 1,000 个随机数并创建直方图。将 bin 边界指定为向量,使宽 bin 在直方图的两边,以捕获不满足 |x|<2 的离群值。第一个向量元素是第一个 bin 的左边界,而最后一个向量元素是最后一个 bin 的右边界。
x = randn(1000,1);
edges = [-10 -2:0.25:2 10];
h = histogram(x,edges);
h.Normalization = 'countdensity';
创建一个表示投票的分类向量。该向量中的类别是 'yes'、'no' 或 'undecided'。
A = [0 0 1 1 1 0 0 0 0 NaN NaN 1 0 0 0 1 0 1 0 1 0 0 0 1 1 1 1];
C = categorical(A,[1 0 NaN],{'yes','no','undecided'})
C = 1x27 categorical
Columns 1 through 9
no no yes yes yes no no no no
Columns 10 through 16
undecided undecided yes no no no yes
Columns 17 through 25
no yes no yes no no no yes yes
Columns 26 through 27
yes yes
使用相对条形宽度 0.5 绘制投票的分类直方图。
h = histogram(C,'BarWidth',0.5)
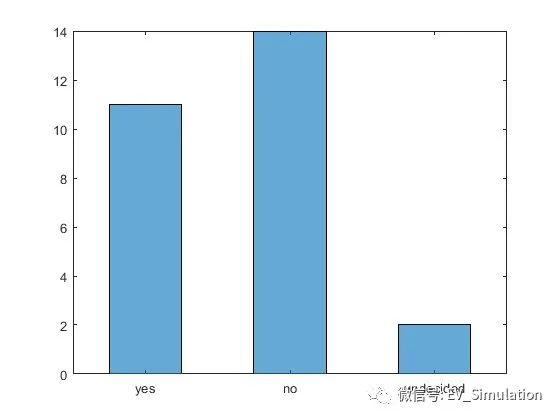
Histogram with properties:
Data: [1x27 categorical]
Values: [11 14 2]
NumDisplayBins: 3
Categories: {'yes' 'no' 'undecided'}
DisplayOrder: 'data'
Normalization: 'count'
DisplayStyle: 'bar'
FaceColor: 'auto'
EdgeColor: [0 0 0]
Show all properties
6.具有指定归一化的直方图
生成 1,000 个随机数并使用 'probability' 归一化创建直方图。
x = randn(1000,1);
h = histogram(x,'Normalization','probability')
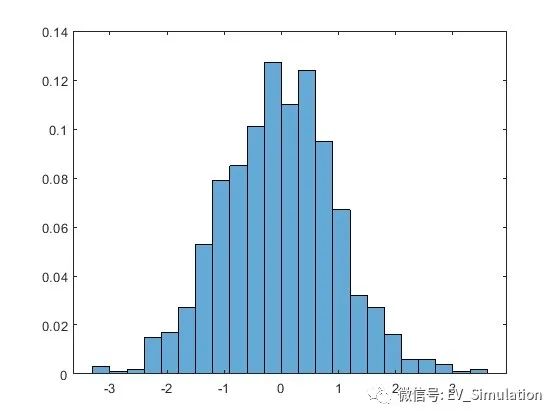
Histogram with properties:
Data: [1000x1 double]
Values: [1x23 double]
NumBins: 23
BinEdges: [1x24 double]
BinWidth: 0.3000
BinLimits: [-3.3000 3.6000]
Normalization: 'probability'
FaceColor: 'auto'
EdgeColor: [0 0 0]
Show all properties
计算条形高度的总和。通过该归一化,每个条形的高度等于在该 bin 间隔内选择观测值的概率,并且所有条形的高度总和为 1。
S = sum(h.Values)
S = 1
7.绘制多个直方图
生成两个随机数向量并在同一图窗中针对每个向量绘制对应的一个直方图。
x = randn(2000,1);
y = 1 + randn(5000,1);
h1 = histogram(x);
hold on
h2 = histogram(y);

h1.Normalization = 'probability';
h1.BinWidth = 0.25;
h2.Normalization = 'probability';
h2.BinWidth = 0.25;

生成 1,000 个随机数并创建直方图。返回直方图对象以调整该直方图的属性,无需重新创建整个绘图。
x = randn(1000,1);
h = histogram(x)
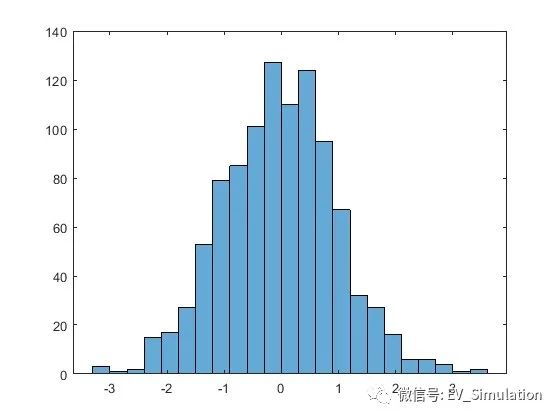
Histogram with properties:
Data: [1000x1 double]
Values: [1x23 double]
NumBins: 23
BinEdges: [1x24 double]
BinWidth: 0.3000
BinLimits: [-3.3000 3.6000]
Normalization: 'count'
FaceColor: 'auto'
EdgeColor: [0 0 0]
Show all properties
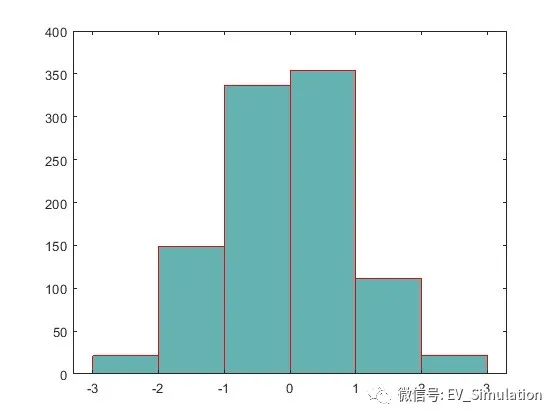
准确指定要使用的 bin 数量。
h.NumBins = 15;
 通过向量指定 bin 边界。向量中的第一个值是第一个 bin 的左边界。最后一个值是最后一个 bin 的右边界。
h.BinEdges = [-3:3];
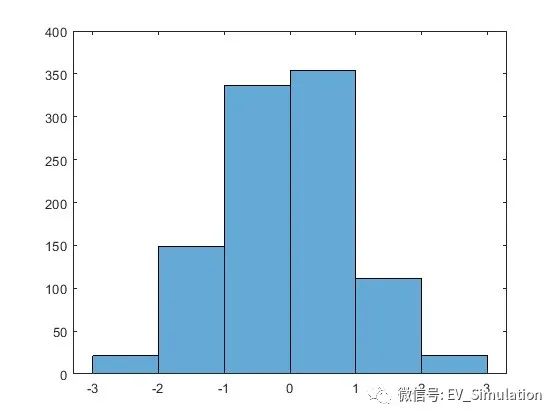
h.FaceColor = [0 0.5 0.5];
h.EdgeColor = 'r';
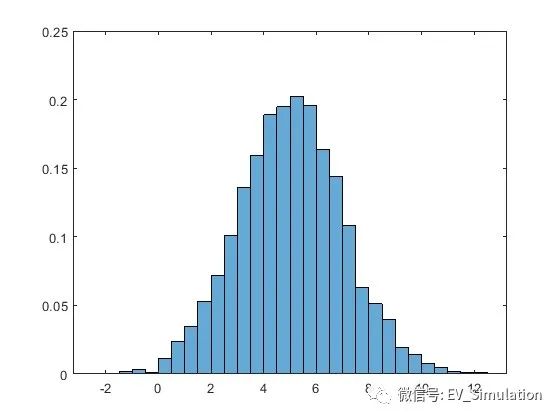
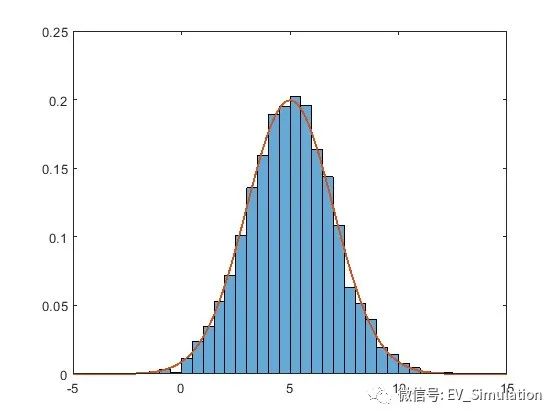
生成 5,000 个均值为 5、标准差为 2 的正态分布随机数。在 Normalization 设为 'pdf' 的情况下绘制直方图可生成概率密度函数的估计值。
x = 2*randn(5000,1) + 5;
histogram(x,'Normalization','pdf')
均值为 μ、标准差为 σ 以及方差为 σ^2
的正态分布的概率密度函数是:
f(x,μ,σ)=1/(σ*sqrt(2π))*exp[−(x−μ)^2/(2*σ^2)].
对于均值为 5、标准差为 2 的正态分布,叠加一个概率密度函数图。
hold on
y = -5:0.1:15;
mu = 5;
sigma = 2;
f = exp(-(y-mu).^2./(2*sigma^2))./(sigma*sqrt(2*pi));
plot(y,f,'LineWidth',1.5)
使用 savefig 函数保存直方图。
y = histogram(randn(10));
savefig('histogram.fig');
clear all
close all
使用 openfig 重新将直方图加载到 MATLAB。openfig 也返回图窗 h 的句柄。
h = openfig('histogram.fig');
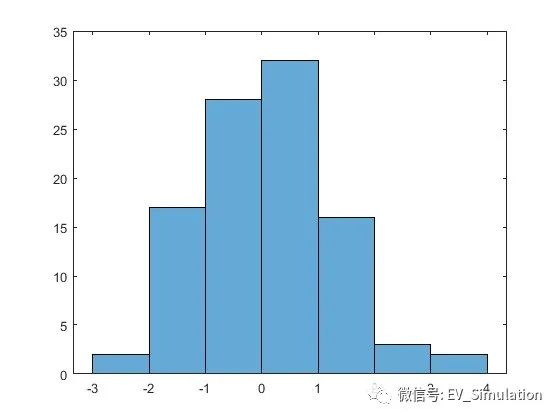
y = findobj(h, 'type', 'histogram')
y =
Histogram with properties:
Data: [10x10 double]
Values: [2 17 28 32 16 3 2]
NumBins: 7
BinEdges: [-3 -2 -1 0 1 2 3 4]
BinWidth: 1
BinLimits: [-3 4]
Normalization: 'count'
FaceColor: 'auto'
EdgeColor: [0 0 0]
Show all properties
【免责声明】本文档部分内容摘自网络平台,版权归原作者所有,仅用于技术分享与交流,非商业用途!若有涉及版权等请告知,将及时修订删除,谢谢大家的关注!

 技术文档
技术文档
 推荐好文
推荐好文


 155-2731-8020