GPT4.0+Midjourney绘画+国内大模型 会员永久免费使用!
【 如果你想靠AI翻身,你先需要一个靠谱的工具! 】
SQL Server的排名函数是对查询的结果进行排名和分组,TSQL共有4个排名函数,分别是:ROW_NUMBER、RANK、DENSE_RANK和NTILE。
他们和OVER()函数搭配使用,按照特定的顺序排名。
排名开窗函数可以单独使用ORDER BY 语句,也可以和PARTITION BY同时使用。
为每一组的行按顺序生成一个唯一的序号。
序列从1开始,按照顺序依次 +1 递增。分组内序列的最大值就是该分组内的行的数目。
1 | ROW_NUMBER ( ) OVER ( [ PARTITION_BY_clause ] order_by_clause ) |
也为每一组的行生成一个序号,但如果按照ORDER BY的排序,如果有相同的值会生成相同的序号,并且接下来的序号是不连续的。
例如,班级中,A,B分数都是100分,C的分数是90分,那么A和B的排名是1,C的排名是3。
和RANK(排名)类似,不同的是如果有相同的序号,那么接下来的序号不会间断。
例如,班级中,A,B分数都是100分,C的分数是90分,那么A和B的排名是1,C的排名是2。
按照指定的数目将数据进行分组,并为每一组生成一个序号。
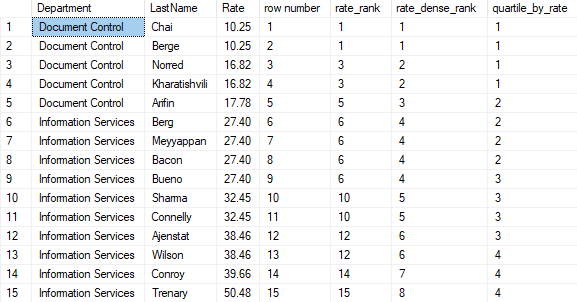
特别地,NTILE(4) 把一个分组分成4份,叫做Quartile。例如,以下脚本显示各个排名函数的执行结果:
1 2 3 4 5 6 7 8 | select Department ,LastName ,Rate ,row_number() over(order by Rate) as [row number] ,rank() over(order by rate) as rate_rank ,dense_rank() over(order by rate) as rate_dense_rank ,ntile(4) over(order by rate) as quartile_by_ratefrom #data |

分析函数基于分组,计算分组内数据的聚合值,经常会和窗口函数OVER()一起使用,使用分析函数可以很方便地计算同比和环比,获得中位数,获得分组的最大值和最小值。
分析函数和聚合函数不同,不需要GROUP BY子句,对SELECT子句的结果集,通过OVER()子句分组。
注意:distinct子句的执行顺序是在分析函数之后。
使用以下脚本插入示例数据:
1 2 3 4 5 6 7 8 9 10 11 12 13 14 15 16 17 18 19 20 21 22 23 24 25 26 27 28 29 30 31 32 33 34 | ;with cte_data as(select 'Document Control' as Department,'Arifin' as LastName,17.78 as Rate union allselect 'Document Control','Norred',16.82 union allselect 'Document Control','Kharatishvili',16.82union allselect 'Document Control','Chai',10.25 union allselect 'Document Control','Berge',10.25 union allselect 'Information Services','Trenary',50.48union allselect 'Information Services','Conroy',39.66 union allselect 'Information Services','Ajenstat',38.46union allselect 'Information Services','Wilson',38.46union allselect 'Information Services','Sharma',32.45union allselect 'Information Services','Connelly',32.45union allselect 'Information Services','Berg',27.40union allselect 'Information Services','Meyyappan',27.40union allselect 'Information Services','Bacon',27.40union allselect 'Information Services','Bueno ',27.40)select Department,LastName,Rate into #data from cte_datago |
SQL Server中共有4类分析函数。
在一次查询中,对数据表进行排序,把已排序的数据从上向下看作是一个序列,对当前行而言,在序列上方的为后,在序列下方的为前。
在同一分组内,对于当前行:
1 2 | LAG (scalar_expression [,offset] [,default]) OVER ( [ partition_by_clause ] order_by_clause )LEAD ( scalar_expression [ ,offset ] , [ default ] ) OVER ( [ partition_by_clause ] order_by_clause ) |
参数注释:
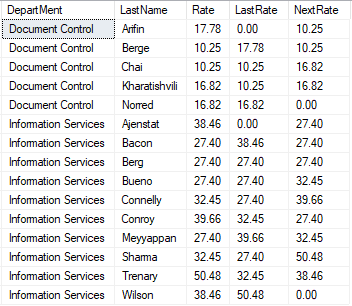
结果日期,这两个函数特别适合用于计算同比和环比。
1 2 3 4 | select DepartMent ,LastName,Rate ,lag(Rate,1,0) over(partition by Department order by LastName) as LastRate ,lead(Rate,1,0) over(partition by Department order by LastName) as NextRatefrom #data order by Department ,LastName |
按照DepartMent进行分组,对Document Control这一小组进行分析:

以下程序代码用来示范如何透过 LAG 函数来计算每一列与前一列的 c2 字段相差几天:
1 2 3 4 5 6 7 8 9 10 11 12 13 14 15 16 17 18 19 20 21 22 23 24 | declare @t table ( c1 int identity ,c2 date ) insert into @t (c2) select '20120101' union all select '20120201' union all select '20120110' union all select '20120221' union all select '20120121' union all select '20120203' select c1,c2 ,LAG(c2) OVER (ORDER BY c2) as previous_c2 ,DateDiff(day,LAG(c2) OVER (ORDER BY c2),c2) as diff from @t order by c2 |
SQL SERVER 2012引入的函数。
获取分组内排在最末尾的行和排在第一位的行:
1 2 | LAST_VALUE ( [scalar_expression ) OVER ( [ partition_by_clause ] order_by_clause rows_range_clause )FIRST_VALUE ( [scalar_expression ] ) OVER ( [ partition_by_clause ] order_by_clause [ rows_range_clause ] ) |
例如:
1 2 3 4 5 6 | select Department, LastName, Rate, row_number() over (partition by Department order by LastName) as FIRSTVALUE, first_value(Rate) over (partition by Department order by LastName rows between unbounded preceding and unbounded following) as FIRSTVALUE, last_value(Rate) over (partition by Department order by LastName rows between unbounded preceding and unbounded following) as LASTVALUEfrom #dataorder by Department, LastName; |
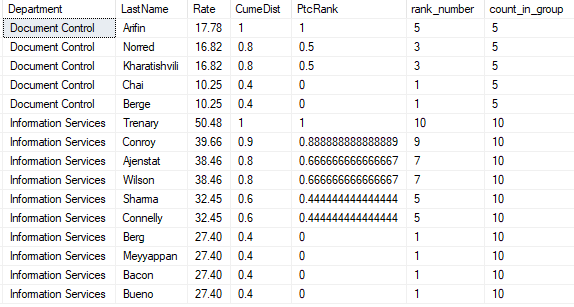
以下代码,用于计算累积分布和排名百分比:
1 2 3 4 5 6 7 8 | select Department,LastName ,Rate ,cume_dist() over(partition by Department order by Rate) as CumeDist ,percent_rank() over(partition by Department order by Rate) as PtcRank ,rank() over(partition by Department order by Rate asc) as rank_number ,count(0) over(partition by Department) as count_in_groupfrom #dataorder by DepartMent ,Rate desc |

解释:
首先,NULL都会被当作最小值。
1、cume_dist的计算方法:小于等于当前行值的行数/总行数。
比如,第3行值为16.82,有4行的值小于等于16.82,本组总行数5行,因此CUME_DIST为4/5=0.8 。
再比如,第4行值为10.25,行值小于等于10.25的共2行,本组总行数5行,因此CUME_DIST为2/5=0.4 。
2、PERCENT_RANK的计算方法:当前RANK值-1/总行数-1 。
比如,第4行的RANK值为1,本组总行数5行,因此PERCENT_RANK为1-1/5-1= 0。
再比如,第7行的RANK值为9,本组总行数10行,因此PERCENT_RANK为9-1/10-1=0.8888888888888889。
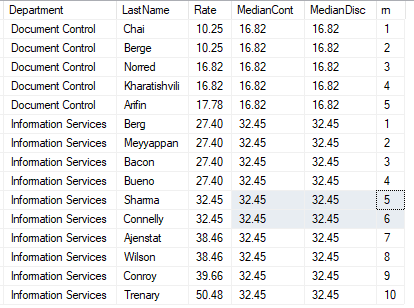
PERCENTILE_CONT和PERCENTILE_DISC都是为了计算百分位的数值,比如计算在某个百分位时某个栏位的数值是多少。
以下脚本用于获得分位数:
1 2 3 4 5 | select Department ,LastName ,Rate ,PERCENTILE_CONT(0.5) WITHIN GROUP (ORDER BY Rate) OVER (PARTITION BY Department) AS MedianCont ,PERCENTILE_DISC(0.5) WITHIN GROUP (ORDER BY Rate) OVER (PARTITION BY Department) AS MedianDisc ,row_number() over(partition by Department order by Rate) as rnfrom #data order by DepartMent ,Rate asc |

到此这篇关于SQL Server排名函数与分析函数的文章就介绍到这了。希望对大家的学习有所帮助,也希望大家多多支持脚本之家。