产品
MATLAB2013b
1)对原始图像进行延拓,然后对进行极值点提取,也就是局部极值点的选取,包括极大值点和极小值点,要求采用领域点比较法,显示出局部极值点,程序运行出来的结果图要体现出提取出来的局部极值点;
2)曲面拟合采用delaunay三角剖分,插值方法首先选择cubic方法,根据实际运行出来的结果图进行插值方法的选取,以得到清晰的imf图像和残余图像为目标,要求程序运行结果图中显示极大极小包络面,delaunay三角剖分不能仅使用matlab自带的delaunay函数,要有优化的过程,验证程序的视频要能体现delaunay函数的使用以及优化的过程,程序运行结果图中要求体现三角剖分的结果以及上下包络面;过程要求:三角剖分图像、极大包络面图像和极小包络面图像;
3)筛选停止条件,
 ,在验证程序的时候要体现出这个停止条件,Sd在0.1到0.3之间;
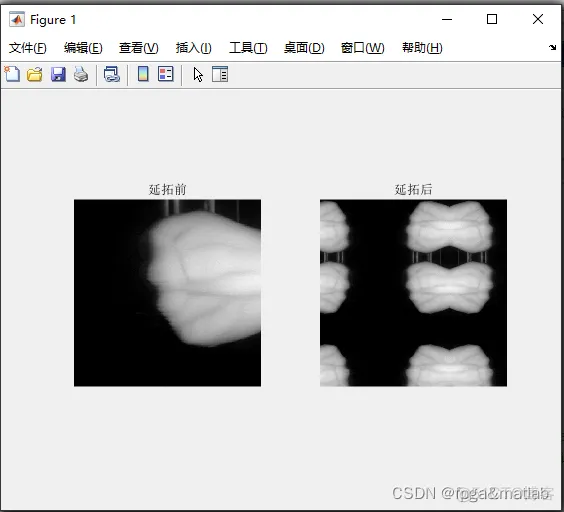
4)对于边界问题的处理,根据实际结果调整镜像延拓的大小。过程要求:延拓之前极大极小值包络面图像和延拓之后极大极小值包络面;
5)通过以上步骤,图像结果包括IMF图像和残余图像,要求输出5层IMF图像和5次残余图像;重点是在分解得到的残余图像上,要求残余图像能够清晰的体现出血管结构;
算法流程图
3.部分核心代码
clc;clear;close all;warning off;addpath 'func\'% %效果动态的显示% views = 1;
%效果静态的显示views = 0;I0      = imread('Images\2.bmp');[R,C,Kss] = size(I0);
if Kss == 1   I = I0; else   I = rgb2gray(I0);  end[R,C] = size(I);%上下各做延拓K    = 240;
X    = func_yantuo(I,1,K);figure(1);subplot(121);imshow(I);title('延拓前');subplot(122);
imshow(X);title('延拓后');%I描述原图象的双精度形式orig      = X;orig      = double(orig);
x_width   = size(X,1); [Rr,Cc]   = size(X); xl_max    = [];xl_min    = [];
%迭代次数Iteration = 5;for iter = 1:Iteration    %步骤一,极大值点图像和极小值点图像    SD    = 10000;
X     = orig;    SDs   = [];    ind   = 0;    while(SD>0.2)         fprintf('SD=%d\n\n',SD);
ind = ind + 1;         %%%%%%%%%%%%%%%%%%%%%%%%%%%%%%%%%%%%%%%%%%%%%%%%%%%%%%%%%%%%%%%%%%%%%%%%%%%%%%%
%%%%%%%%%%%%%%%%%%%%%%%%%%%%%%%%%%%%%%%%%%%%%%%%%%%%%         %建立极值图象,极大值图象XMAX,极小值图象XMIN
[XMAX,XMIN,xl_max,xl_min] = func_find_max_min(X);         if views == 0 & ind == 1 & iter == 1
figure(2);            subplot(221);imshow(XMAX(K+1:R+K,K+1:C+K),[]);title('极大值点图像(延拓部分不显示)');
subplot(222);imshow(XMIN(K+1:R+K,K+1:C+K),[]);title('极小值点图像(延拓部分不显示)');
subplot(223);imshow(XMAX,[]);title('极大值点图像');            subplot(224);imshow(XMIN,[]);
title('极小值点图像');                  end         if views == 1 & ind > 1            figure(2);
subplot(221);imshow(XMAX(K+1:R+K,K+1:C+K),[]);title('极大值点图像(延拓部分不显示)');
subplot(222);imshow(XMIN(K+1:R+K,K+1:C+K),[]);title('极小值点图像(延拓部分不显示)');
subplot(223);imshow(XMAX,[]);title('极大值点图像');            subplot(224);imshow(XMIN,[]);
title('极小值点图像');                  end                           %%%%%%%%%%%%%%%%%%%%%%%%%%%%%%%%%%%%%
%%%%%%%%%%%%%%%%%%%%%%%%%%%%%%%%%%%%%%%%%%%%%%%%%%%%%%%%%%%%%%%%%%%%%%%%%%%%%%%%%%%%%%%%%%%%%%%
%构造上下包络         %delaunay         [r_max,c_max,v_max] = find(XMAX);
[r_min,c_min,v_min] = find(XMIN);          tri1=delaunay(c_max,r_max);
tri2=delaunay(c_min,r_min);         if  views == 0 & ind == 1 & iter == 1
figure(3);             subplot(121);             triplot(tri1,c_max,r_max);title('极大值点三角剖分');
axis square;             subplot(122);             triplot(tri2,c_min,r_min);title('极小值点三角剖分');
axis square;         end         if  views == 1 & ind > 0             figure(3);
subplot(121);             triplot(tri1,c_max,r_max);title('极大值点三角剖分');             axis square;
subplot(122);             triplot(tri2,c_min,r_min);title('极小值点三角剖分');             axis square;
end                           %极大值包络,极小值包络         %基于delaunay的三角剖分插值算法,非常的耗内存,如果你的电脑
内存OK > 32G,那么可以尝试测试         %另外你要求的那个,只能依靠griddata函数的delaunay法来设计,如果自己编程序,估计内存更
不够         %自己写的函数肯定没matlab自带的效率高         %内存>32G 选择:         [zi_max,zi_min] = func_max_min_ev
enlop(xl_max,xl_min,Rr,Cc,1);%delaunay         %内存<32G 选择:         %[zi_max,zi_min] = func_max_min_evenlop(
xl_max,xl_min,Rr,Cc,2);                           if views == 0 & ind == 1 & iter == 1            figure(4);
subplot(221);imshow(zi_max(K+1:R+K,K+1:C+K),[]);title('极大值包络(延拓部分不显示)');            subplot(
222);imshow(zi_min(K+1:R+K,K+1:C+K),[]);title('极小值包络(延拓部分不显示)');            subplot(223);ims
how(zi_max,[]);title('极大值包络');            subplot(224);imshow(zi_min,[]);title('极小值包络');
end            if views == 1 & ind > 0            figure(4);            subplot(221);imshow(zi_max(K+1:R+K,
K+1:C+K),[]);title('极大值包络(延拓部分不显示)');            subplot(222);imshow(zi_min(K+1:R+K,K+1:C+K),[]);
title('极小值包络(延拓部分不显示)');            subplot(223);imshow(zi_max,[]);title('极大值包络');
subplot(224);imshow(zi_min,[]);title('极小值包络');         end                              %计算SD
zi =(zi_max+zi_min)/2;         mi = zi(K+1:R+K,K+1:C+K);         h  = orig(K+1:R+K,K+1:C+K);
SD = max(abs(mi)^2)/max(h).^2;         X  = X-zi;          SDs= [SDs,SD];    end    %%%%%%%%%%%%%%%%%%%%%%%
%%%%%%%%%%%%%%%%%%%%%%%%%%%%%%%%%%%%%%%%%%%%%%%%%%%%%%%%%%%%%%%%%%%%%%%%%%%%%%%%%%%%%%%%%%%%%%%%%%%%%%%%%%%%
%        imf=X;    if iter == 1        SDs2 = SDs;        imf1 = imf(K+1:R+K,K+1:C+K);       r    = orig-imf;
r1   = r(K+1:R+K,K+1:C+K);       %重建       Rcon1= func_recontruct(I,imf1);    end    if iter == 2
imf2 = imf(K+1:R+K,K+1:C+K);       r    = orig-imf;       r2   = r(K+1:R+K,K+1:C+K);
%重建       Rcon2= func_recontruct(I,imf2);    end    if iter == 3        imf3 = imf(K+1:R+K,K+1:C+K);
r    = orig-imf;       r3   = r(K+1:R+K,K+1:C+K);       %重建       Rcon3= func_recontruct(I,imf2+imf3);
end       if iter == 4        imf4 = imf(K+1:R+K,K+1:C+K);       r    = orig-imf;       r4   = r(K+1:R+K,K+1:
C+K);       %重建       Rcon4= func_recontruct(I,imf2+imf3+imf4);    end        if iter == 5
imf5 = imf(K+1:R+K,K+1:C+K);       r    = orig-imf;       r5   = r(K+1:R+K,K+1:C+K);       %重建
Rcon5= func_recontruct(I,imf2+imf3+imf4+imf5);    end      orig=orig-imf;    pause(1);endfigure;
semilogy(SDs2,'b-o');xlabel('迭代次数');ylabel('SD值');grid on; figure;subplot(231);imshow(I0,[]);
title('原图');subplot(232);imshow(imf1,[]) ;title('imf1');subplot(233);imshow(imf2,[]); title('imf2');
subplot(234);imshow(imf3,[]); title('imf3');subplot(235);imshow(imf4,[]);title('imf4');subplot(236);
imshow(imf5,[]);title('imf5');figure;subplot(231);imshow(I0,[]);title('原图');subplot(232);imshow(r1,[]);
title('r1');subplot(233);imshow(r2,[]);title('r2');subplot(234);imshow(r3,[]);title('r3');subplot(235);
imshow(r4,[]); title('r4');subplot(236);imshow(r5,[]); title('r5'); figure;subplot(221);imshow(Rcon2,[]);
title('滤波图像1');subplot(222);imshow(Rcon3,[]); title('滤波图像2');subplot(223);imshow(Rcon4,[]);
title('滤波图像3');subplot(224);imshow(Rcon5,[]);title('滤波图像4'); figure;subplot(121);imshow(I0,[]);
title('原始图像');subplot(122);imshow(Rcon5,[]); title('处理后图像');1.2.3.4.5.6.7.8.9.10.11.12.13.14.15.16.
17.18.19.20.21.22.23.24.25.26.27.28.29.30.31.32.33.34.35.36.37.38.39.40.41.42.43.44.45.46.47.48.49.50.51.
52.53.54.55.56.57.58.59.60.61.62.63.64.65.66.67.68.69.70.71.72.73.74.75.76.77.78.79.80.81.82.83.84.85.86.
87.88.89.90.91.92.93.94.95.96.97.98.99.100.101.102.103.104.105.106.107.108.109.110.111.112.113.114.115.116.
117.118.119.120.121.122.123.124.125.126.127.128.129.130.131.132.133.134.135.136.137.138.139.140.141.142.143.
144.145.146.147.148.149.150.151.152.153.154.155.156.157.158.159.160.161.162.163.164.165.166.167.168.169.170.
171.172.173.174.175.176.177.178.179.180.181.182.183.184.185.186.187.188.189.190.191.192.193.194.195.196.197.
198.199.200.201.202.203.204.205.206.207.208.209.210.211.212.213.214.215.216.217.218.219.220.221.222.223.224.
225.226.227.228.229.230.231.232.233.234.235.236.237.238.239.240.241.242.243.244.245.246.247.248.


免责声明:本文系网络转载或改编,未找到原创作者,版权归原作者所有。如涉及版权,请联系删