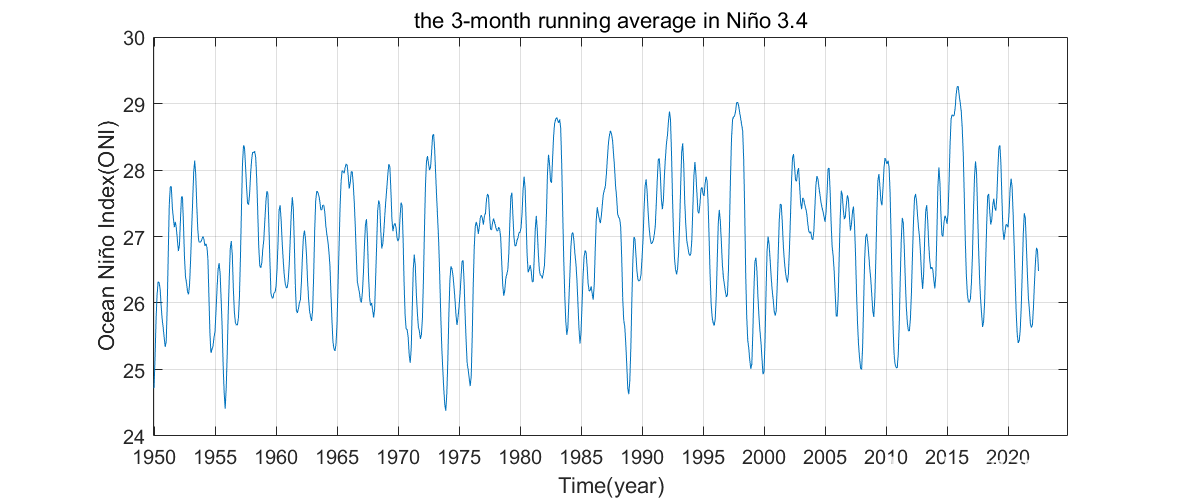
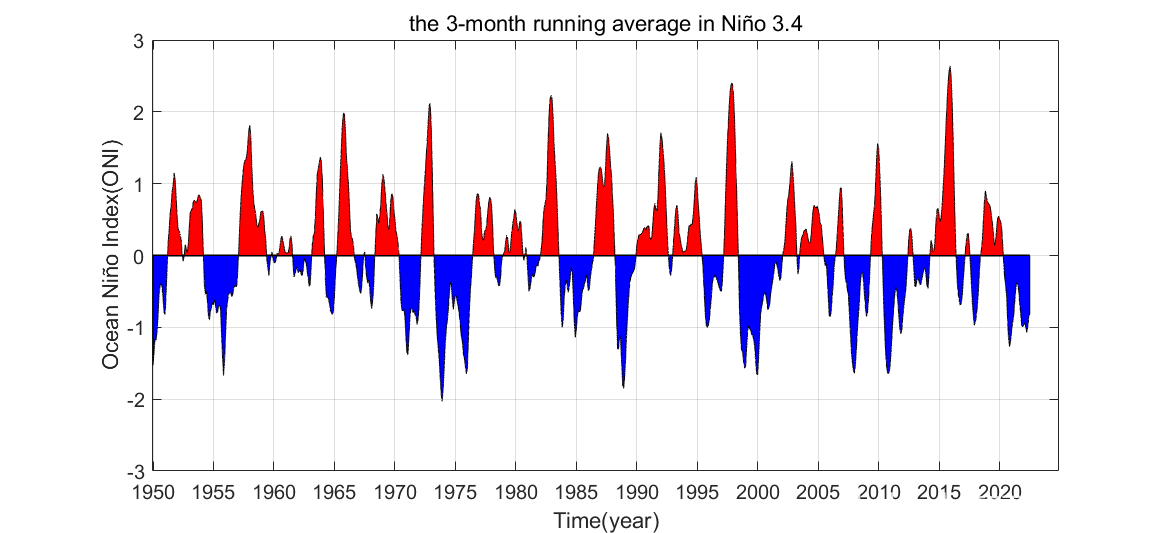
本代码可实现下载、读取、可视化Ocean nino Index(ONI)。
% Ocean_nino_Index(ONI)_from_ERSSTv5
% data from https://origin.cpc.ncep.noaa.gov/data/indices/
% Seasonal ERSSTv5 (centered base periods) "Oceanic Niño Index" or
% the 3-month running average in Niño 3.4 (5oNorth-5oSouth) (170-120oWest))
% Data (Oceanic Nino Index):
% https://origin.cpc.ncep.noaa.gov/data/indices/oni.ascii.txt
% Jia-Shun Wang
% Email: wjs@hrbeu.edu.cn / wjs@outlook.at
% Personal Academic Website: https://jia-shun.wang
% 2022.09.18 in First Institute of Oceanography(FIO)
clear;close;clc
%% 0 download timeseries
filename='oni.ascii.txt';
url=['https://origin.cpc.ncep.noaa.gov/data/indices/',filename];
format shortG
Index_table=readtable(url,'FileType','text');
% save it to the local disk.
output_path='data/Climate Timeseries/';
writetable(Index_table,[output_path,filename,'.xlsx']);
%% 1 read data
filename='oni.ascii.txt';
target_data=['data/Climate Timeseries/',filename,'.xlsx'];
Timeseries_table=readtable(target_data);
start_year=1950;end_year=2022;
start_raws=find(Timeseries_table.YR==start_year);
start_raw=start_raws(1);
end_raws=find(Timeseries_table.YR==end_year);
end_raw=end_raws(end);
Timeseries_table(end_raw+1:end,:)=[];%remove the year after end-year first
Timeseries_table(1:start_raw-1,:)=[];%remove the year before start-year
Timeseries_length=length(Timeseries_table.TOTAL);
%% 2 plot line graph
figure('name','Ocean_nino_Index(ONI)','color','w')
figure_Y=Timeseries_table.TOTAL;
plot(figure_Y)
set(gca,'xtick',1:5*12:Timeseries_length,...
'xticklabel',start_year:5:end_year,'fontsize',15)%5 years=60 months
grid on
xlabel('Time(year)')
ylabel('Ocean Niño Index(ONI)')
title('the 3-month running average in Niño 3.4')
%% 3 plot phase graph
x0=1:Timeseries_length;
x=1:0.001:Timeseries_length;
y0=zeros(size(x));
figure_Y=Timeseries_table.ANOM;
y=interp1(x0,figure_Y,x);
figure('name','nino-color','color','w')
plot(x,y0,'k','linewidth',1.5)
hold on
iip=find(y>=0);
xp=x(iip);yp=y(iip);
iin=find(y<0);
xn=x(iin);yn=y(iin);
fill([xp,xp(end),xp(1)],[yp,0,0],'r')
fill([xn,xn(end),xn(1)],[yn,0,0],'b')
set(gca,'xtick',1:5*12:Timeseries_length,...
'xticklabel',start_year:5:end_year,'fontsize',15)%5 years=60 months
grid on
xlabel('Time(year)')
ylabel('Ocean Niño Index(ONI)')
title('the 3-month running average in Niño 3.4')

ONI

ONI-anomaly
免责声明:本文系网络转载或改编,未找到原创作者,版权归原作者所有。如涉及版权,请联系删