


软件

产品


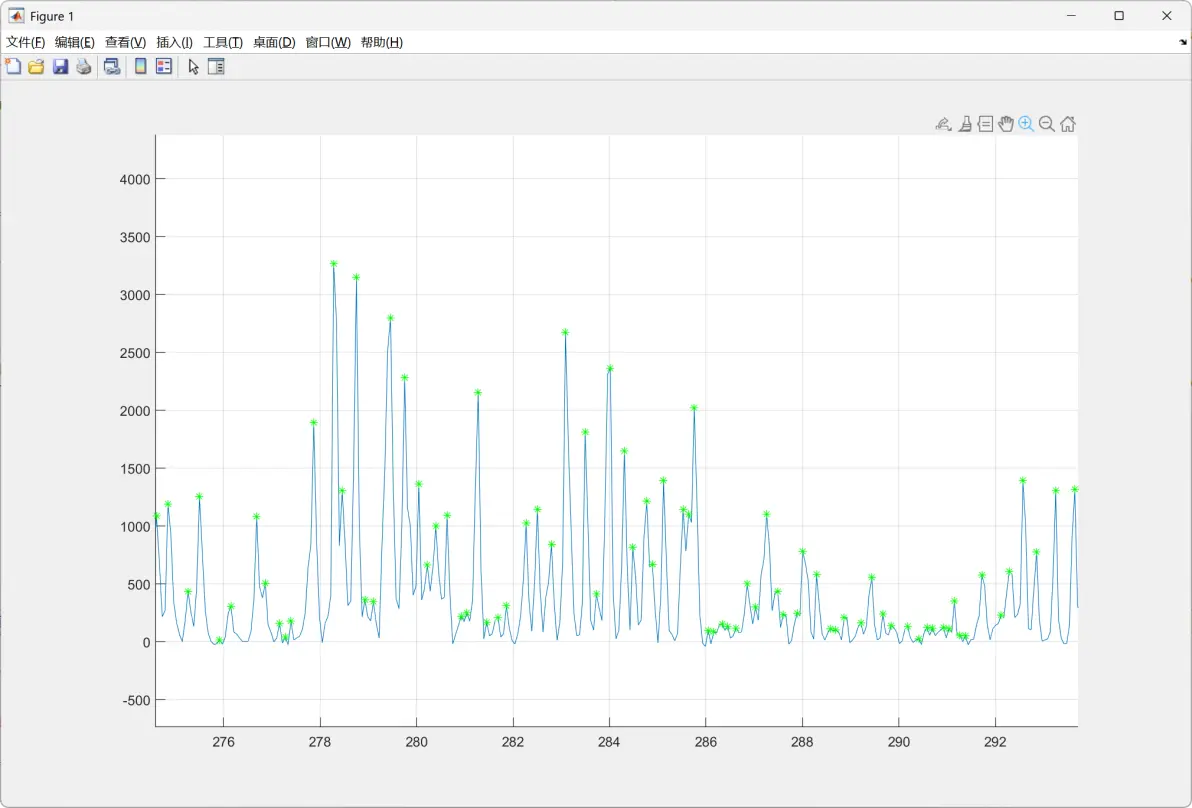
clear all
;
%init
%read data
data1 = xlsread('Times.csv');
x=data1(:,1);
y=data1(:,2);
%find the maxim data
hold on;%mix the diagram
plot(x,y);
grid on
% find the peak data in the serial waveforms
%peakdata = findpeaks(y);
[peakdata,locs]=findpeaks(y);
for i=1:size(locs)
locs1(i,1)=x(locs(i,1),1);
end
plot(locs1,peakdata,'*','color','g');
over(:,1)=locs1;
over(:,2)=peakdata;
xlswrite('test.xlsx',over)
免责声明:本文系网络转载或改编,未找到原创作者,版权归原作者所有。如涉及版权,请联系删
 技术文档
技术文档
 推荐好文
推荐好文





 155-2731-8020