


软件

产品


如果下载速度慢,可以使用教育网 下载地址
pip install altair vega_datasets -i https://pypi.tuna.tsinghua.edu.cn/simpleimport altair as altimport pandas as pddf = pd.read_csv('https://anvil.works/blog/img/plotting-in-python/uk-election-results.csv')dfbrush = alt.selection_interval()alt.Chart(df).mark_point().encode( x='year:Q', y='liberal:Q', color=alt.condition(brush, 'others:N', alt.value('lightgray'))).add_selection( brush)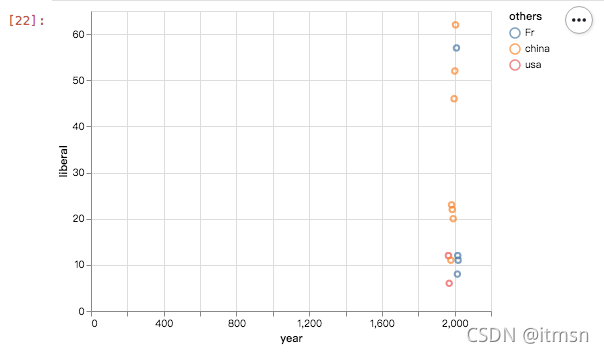
alt.Chart(df).mark_bar().encode( y='others:N', color='year:N', x='count(labour):Q') 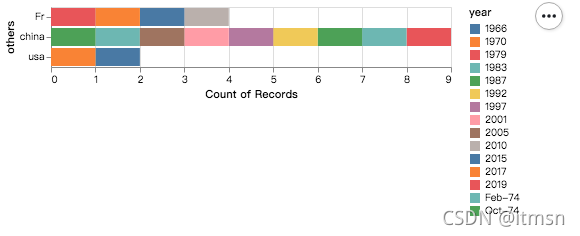
免责声明:本文系网络转载或改编,未找到原创作者,版权归原作者所有。如涉及版权,请联系删
 技术文档
技术文档
 推荐好文
推荐好文


 155-2731-8020


