


取色板中的颜色
# 查看颜色
library(RColorBrewer)
display.brewer.all()
display.brewer.pal(5, "RdBu")
brewer.pal(3, "RdBu")
以下内容来自:https://www.datanovia.com/en/blog/top-r-color-palettes-to-know-for-great-data-visualization/
用于更改使用ggplot2包或R基本绘图函数生成的图形的默认颜色的顶部R调色板。
演示数据集
我们将使用R内置的iris演示数据集。
head(iris, 6)
##   Sepal.Length Sepal.Width Petal.Length Petal.Width Species
## 1          5.1         3.5          1.4         0.2  setosa
## 2          4.9         3.0          1.4         0.2  setosa
## 3          4.7         3.2          1.3         0.2  setosa
## 4          4.6         3.1          1.5         0.2  setosa
## 5          5.0         3.6          1.4         0.2  setosa
## 6          5.4         3.9          1.7         0.4  setosa
创建一个按组着色的基本ggplot
您可以通过以下方式根据分组变量更改颜色:
- 将参数映射
color到目标变量。这将应用于点,线和文本 - 将参数映射
fill到目标变量。这将更改区域的填充颜色,例如箱形图,条形图,直方图,密度图等。
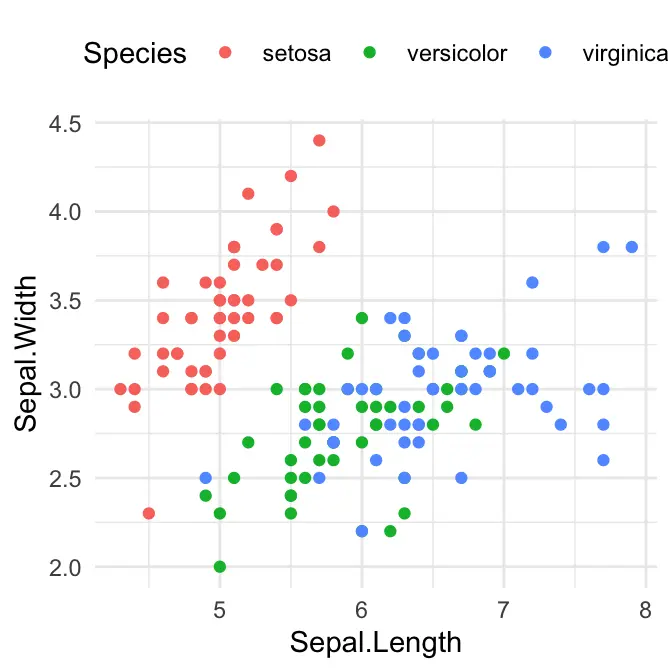
在我们的例子中,我们将映射选项color,并fill在分组变量Species分别为散点图和箱形图。
使用Species变量级别按组更改颜色:
library("ggplot2")
# Box plot
bp <- ggplot(iris, aes(Species, Sepal.Length)) +
  geom_boxplot(aes(fill = Species)) +
  theme_minimal() +
  theme(legend.position = "top")
bp

# Scatter plot
sp <- ggplot(iris, aes(Sepal.Length, Sepal.Width)) +
  geom_point(aes(color = Species)) +
  theme_minimal()+
  theme(legend.position = "top")
sp

Viridis调色板
在viridis[R包(由西蒙·卡尼尔)提供了调色板,使美丽的情节是:打印机友好的,感知均匀,易于被那些色盲阅读。
如下安装并加载软件包:
install.packages("viridis")  # Install
library("viridis")           # Load
该viridis软件包包含四个顺序的色标:“ Viridis”(主要选择)和三个具有类似属性的替代色标(“岩浆”,“血浆”和“地狱”)。

主要功能:
scale_color_viridis():更改点,线和文本的颜色scale_fill_viridis():更改区域的填充颜色(箱形图,条形图等)viridis(n),magma(n),inferno(n)和plasma(n):生成用于基情节,其中调色板n是的颜色来返回数量。
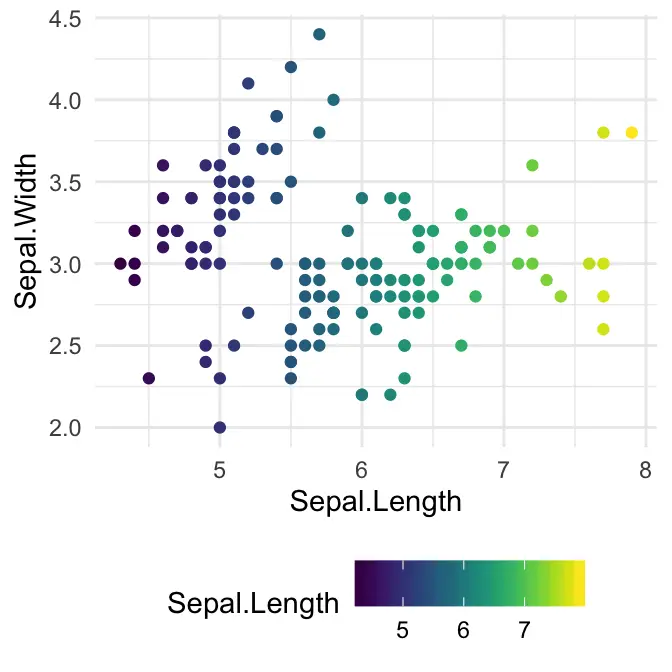
请注意,函数scale_color_viridis()和scale_fill_viridis()具有一个名为的参数option,该参数是一个字符串,指示要使用的colormap选项。共有四个选项:“岩浆”(或“ A”),“地狱”(或“ B”),“血浆”(或“ C”)和“ viridis”(或“ D”,默认选项)。
- ggplot2中的用法
library(ggplot2)
# Gradient color
ggplot(iris, aes(Sepal.Length, Sepal.Width))+
  geom_point(aes(color = Sepal.Length)) +
  scale_color_viridis(option = "D")+
  theme_minimal() +
  theme(legend.position = "bottom")

# Discrete color. use the argument discrete = TRUE
ggplot(iris, aes(Sepal.Length, Sepal.Width))+
  geom_point(aes(color = Species)) +
  geom_smooth(aes(color = Species, fill = Species), method = "lm") +
  scale_color_viridis(discrete = TRUE, option = "D")+
  scale_fill_viridis(discrete = TRUE) +
  theme_minimal() +
  theme(legend.position = "bottom")

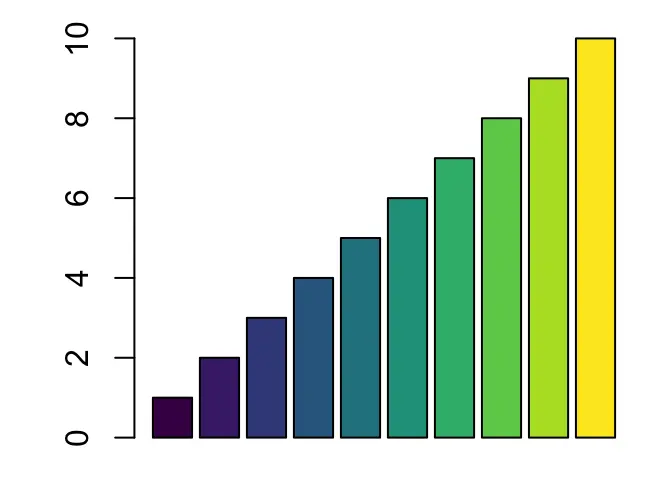
- 基本图中的用法。使用该函数
viridis()生成所需的颜色数量:
barplot(1:10, col = viridis(10))
RColorBrewer调色板
RColorBrewer软件包创建了一个漂亮的调色板。您应该首先按照以下步骤进行安装:install.packages("RColorBrewer")。
要显示包装中的所有调色板,请键入以下内容:
library(RColorBrewer)
display.brewer.all()
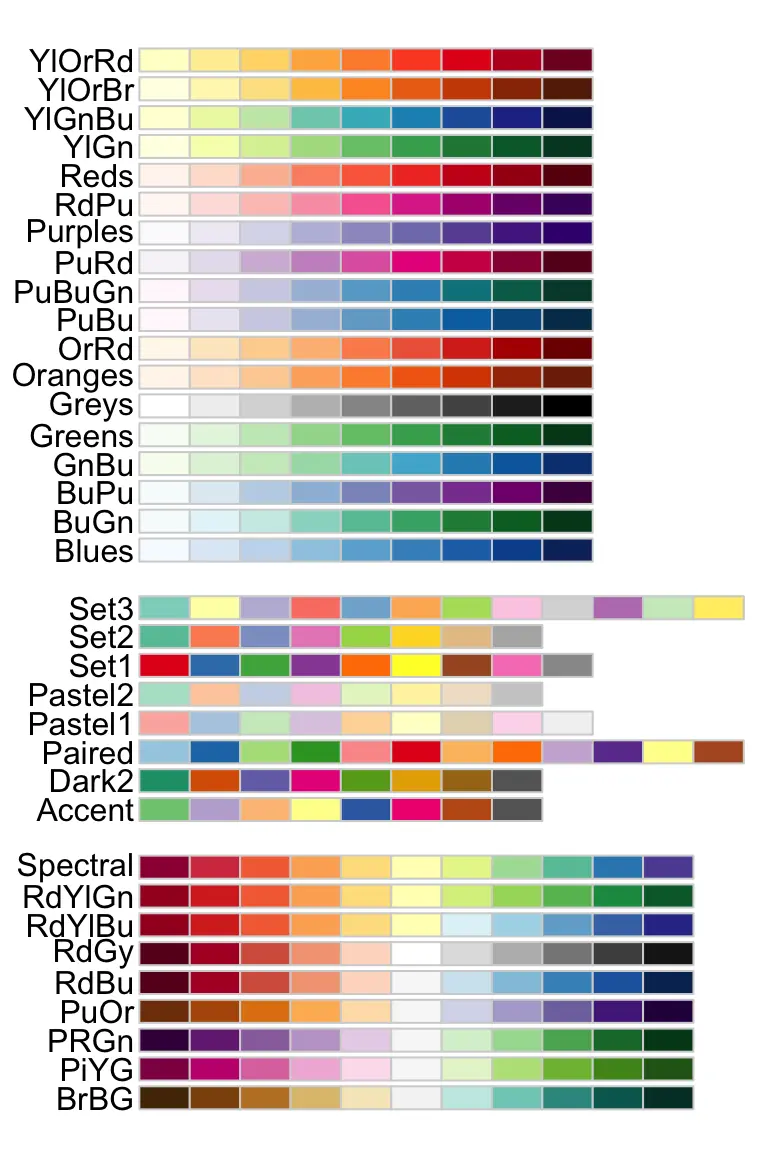
该软件包包含3种类型的调色板:顺序,发散和定性。
- 顺序调色板(第一个颜色列表),适合从低到高(渐变)的有序数据。调色板名称为:蓝调,BuGn,BuPu,GnBu,绿色,灰色,橘子,OrRd,PuBu,PuBuGn,PuRd,Purples,RdPu,Reds,YlGn,YlGnBu YlOrBr,YlOrRd。
- 定性调色板(第二种颜色列表),最适合表示名义或分类数据。它们并不暗示组之间的大小差异。调色板名称为:重音,暗2,成对,柔和1,柔和2,设置1,设置2,设置3。
- 不同的调色板(第三种颜色列表),同样强调数据范围两端的中间范围临界值和极限值。不同的调色板是:BrBG,PiYG,PRGn,PuOr,RdBu,RdGy,RdYlBu,RdYlGn,光谱
RColorBrewer软件包还包括三个重要功能:
# 1\. Return the hexadecimal color specification
brewer.pal(n, name)

# 2\. Display a single RColorBrewer palette
# by specifying its name
display.brewer.pal(n, name)

# 3\. Display all color palette
display.brewer.all(n = NULL, type = "all", select = NULL,
                   colorblindFriendly = FALSE)
函数参数说明:
n:调色板中不同颜色的数量,最少3种,最大数量取决于调色板。name:以上列表中的调色板名称。例如name = RdBu。type:要显示的调色板类型。允许的值为以下之一:“ div”,“ qual”,“ seq”或“ all”。select:要显示的调色板名称列表。colorblindFriendly:如果为TRUE,则仅显示色盲友好调色板。
要仅显示色盲友好的酿酒机调色板,请使用以下R代码:
display.brewer.all(colorblindFriendly = TRUE)

您还可以通过如下指定其名称来查看单个RColorBrewer调色板:
# View a single RColorBrewer palette by specifying its name
display.brewer.pal(n = 8, name = 'Dark2')

# Hexadecimal color specification
brewer.pal(n = 8, name = "Dark2")
## [1] "#1B9E77" "#D95F02" "#7570B3" "#E7298A" "#66A61E" "#E6AB02" "#A6761D"
## [8] "#666666"
ggplot2中的用法。ggplot2中有两个色标功能可用于使用Brebrewer调色板:
scale_fill_brewer()用于箱形图,条形图,小提琴图,点图等scale_color_brewer()用于线和点
# Box plot
bp + scale_fill_brewer(palette = "Dark2")

# Scatter plot
sp + scale_color_brewer(palette = "Dark2")


在基本图中的用法。该函数brewer.pal()用于生成颜色向量。
# Barplot using RColorBrewer
barplot(c(2,5,7), col = brewer.pal(n = 3, name = "RdBu"))
灰色调色板
主要功能:
scale_fill_grey()用于箱形图,条形图,小提琴图,点图等scale_colour_grey()用于点,线等
# Box plot
bp + scale_fill_grey(start = 0.8, end = 0.2)

# Scatter plot
sp + scale_color_grey(start = 0.8, end = 0.2
武汉格发信息技术有限公司,格发许可优化管理系统可以帮你评估贵公司软件许可的真实需求,再低成本合规性管理软件许可,帮助贵司提高软件投资回报率,为软件采购、使用提供科学决策依据。支持的软件有: CAD,CAE,PDM,PLM,Catia,Ugnx, AutoCAD, Pro/E, Solidworks 等。

 技术文档
技术文档
 推荐好文
推荐好文


 155-2731-8020